• Journal of Geographical Sciences
  • Vol. 30, Issue 1, 145 (2020)
Boyuan ZHU1、1、1、1、1、1、1、1、1、1、1、1, Yitian LI1、1、1、1、1、1, Yao YUE1、1、1、1、1、1、1、1、1、1、1、1、*, Yunping YANG1、1、1、1、1、1, Enhang LIANG1、1、1、1、1、1, Chuncai ZHANG1、1、1、1、1、1、1、1、1、1、1、1, and Alistair G. L. BORTHWICK1、1、1、1、1、1
Author Affiliations
  • 11School of Hydraulic Engineering, Changsha University of Science & Technology, Changsha 410114, China
  • 12Key Laboratory of Water-Sediment Sciences and Water Disaster Prevention of Hunan Province, Changsha 410114, China
  • 13School of Water Resources and Hydropower Engineering, State Key Laboratory of Water Resources and Hydropower Engineering Science, Wuhan University, Wuhan 430072, China
  • 14Key Laboratory of Engineering Sediment, Tianjin Research Institute for Water Transport Engineering, Ministry of Transport, Tianjin 300456, China
  • 15The Key Laboratory of Water and Sediment Sciences, Ministry of Education; College of Environmental Sciences and Engineering, Peking University, Beijing 100871, China
  • 16School of Engineering, The University of Edinburgh, The King’s Buildings, Edinburgh EH9 3JL, UK
  • show less
    DOI: 10.1007/s11442-020-1720-0 Cite this Article
    Boyuan ZHU, Yitian LI, Yao YUE, Yunping YANG, Enhang LIANG, Chuncai ZHANG, Alistair G. L. BORTHWICK. Alternate erosion and deposition in the Yangtze Estuary and the future change[J]. Journal of Geographical Sciences, 2020, 30(1): 145 Copy Citation Text show less
    Important locations and geographical features of the Yangtze Estuary. (a) Locations of the Datong station, the Three Gorges Dam (TGD), the Gezhou Dam (GZD) and the Danjiangkou Dam (DJKD) within the Yangtze River Basin of China, and the Yangtze Estuary (the study area); (b) plan view of the Yangtze Estuary; CES, HES and NES represent Chongming East Shoal, Hengsha East Shoal and Nanhui East Shoal, respectively; the region enclosed by the red line almost covers the entire Yangtze Estuary downstream of Xuliujing, which is identical to that in Chen Y et al. (2018) providing the major dataset of total erosional/depositional rate in this study; (c) major sediment sources of the Yangtze Estuary.
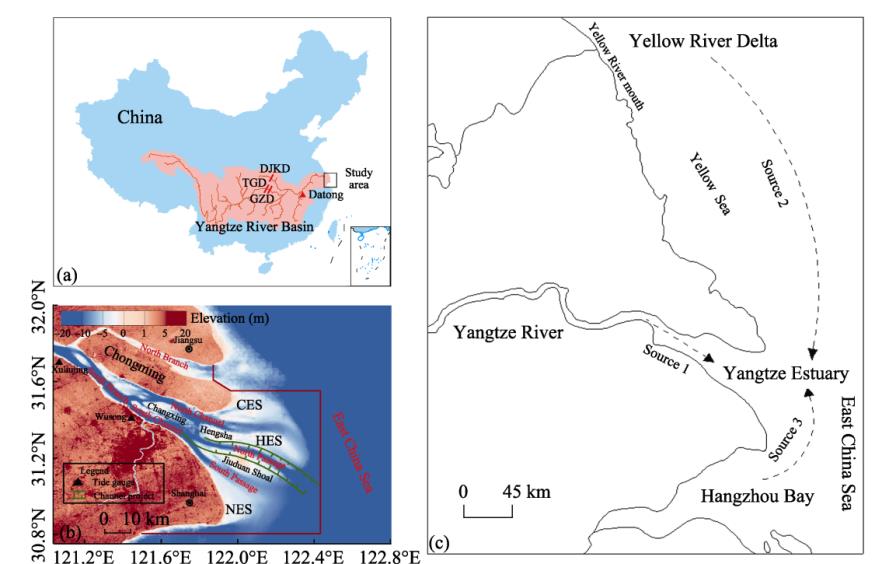
    Fig. 1. Important locations and geographical features of the Yangtze Estuary. (a) Locations of the Datong station, the Three Gorges Dam (TGD), the Gezhou Dam (GZD) and the Danjiangkou Dam (DJKD) within the Yangtze River Basin of China, and the Yangtze Estuary (the study area); (b) plan view of the Yangtze Estuary; CES, HES and NES represent Chongming East Shoal, Hengsha East Shoal and Nanhui East Shoal, respectively; the region enclosed by the red line almost covers the entire Yangtze Estuary downstream of Xuliujing, which is identical to that in Chen Y et al. (2018) providing the major dataset of total erosional/depositional rate in this study; (c) major sediment sources of the Yangtze Estuary.
    Comparison between morphological and hydrological processes in the Yangtze Estuary. (a) Histogram of erosional/depositional rates (positive values indicating deposition, and negative ones representing erosion) of the marked submerged area (Figure 1b) in the periods of 1950-1958, 1958-1983, 1983-1997, 1997-2002, 2002-2009, 2009-2013 and 2013-2015, respectively; dashed arrow during 1950-1958 represents an erosional state of the marked submerged area and red-bold line segment over 1983-1997 stands for an equilibrium state. (b) Yearly river water discharge, D≥60,000 and yearly and multi-year average river sediment load at Datong from 1950 to 2015.
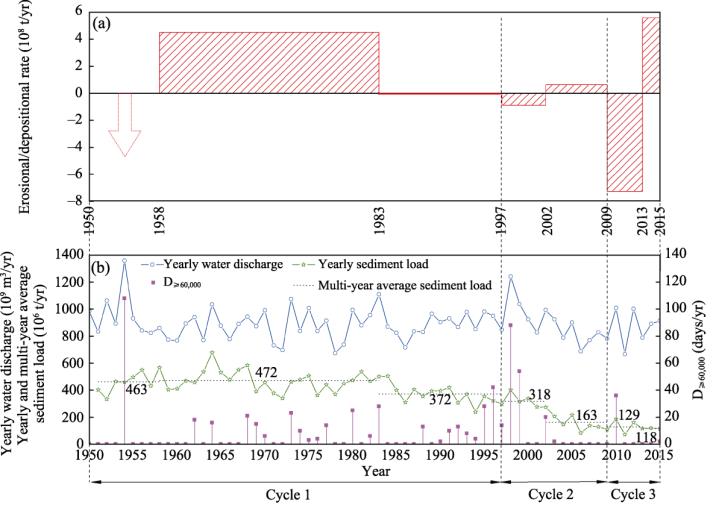
    Fig. 2. Comparison between morphological and hydrological processes in the Yangtze Estuary. (a) Histogram of erosional/depositional rates (positive values indicating deposition, and negative ones representing erosion) of the marked submerged area (Figure 1b) in the periods of 1950-1958, 1958-1983, 1983-1997, 1997-2002, 2002-2009, 2009-2013 and 2013-2015, respectively; dashed arrow during 1950-1958 represents an erosional state of the marked submerged area and red-bold line segment over 1983-1997 stands for an equilibrium state. (b) Yearly river water discharge, D≥60,000 and yearly and multi-year average river sediment load at Datong from 1950 to 2015.
    Residual water level changing with distance upstream from the Yangtze River mouth with varying monthly river water discharge in 2005.
    Fig. 3. Residual water level changing with distance upstream from the Yangtze River mouth with varying monthly river water discharge in 2005.
    Yearly dredging amount of the Deepwater Channel Project from 2000 to 2015 (a) and multi-year average reclamation rates over the whole Yangtze Estuary during the periods of 1960-1980, 1980-2000, 2000-2010 and 2010-2015 (b) and erosional/depositional rates (positive values indicating deposition, and negative ones representing erosion) of the entire Yangtze Estuary during the comparative periods ((a) and (b)).
    Fig. 4. Yearly dredging amount of the Deepwater Channel Project from 2000 to 2015 (a) and multi-year average reclamation rates over the whole Yangtze Estuary during the periods of 1960-1980, 1980-2000, 2000-2010 and 2010-2015 (b) and erosional/depositional rates (positive values indicating deposition, and negative ones representing erosion) of the entire Yangtze Estuary during the comparative periods ((a) and (b)).
    Spatial distribution of bed-elevation changing rates (positive values indicating deposition, and negative ones representing erosion) in the Yangtze mouth bar area (121.78°E-122.34°E, 30.96°N-31.46°N) during the periods of (a) 1997-2002 and (b) 2002-2007
    Fig. 5. Spatial distribution of bed-elevation changing rates (positive values indicating deposition, and negative ones representing erosion) in the Yangtze mouth bar area (121.78°E-122.34°E, 30.96°N-31.46°N) during the periods of (a) 1997-2002 and (b) 2002-2007
    Comparison of net sediment supplies at Xuliujing and the Yangtze River mouth with depositional rates within (a) Area 1, (b) Area 2 and (c) Area 3 during 2002-2009. Specifically, Area 1 represents the mouth bar area (121.78°E-122.34°E, 30.96°N-31.46°N) in Figure 5, Area 2 the submerged delta (121.78°E-122.67°E, 30.82°N- 31.53°N) in Dai et al. (2014a), and Area 3 the large submerged area of the entire Yangtze Estuary downstream of Xuliujing in Chen Y et al. (2018). In addition, the blue numbers represent the net sediment fluxes at Xuliujing and the Yangtze River mouth, whereas the magenta numbers indicate the depositional rates of the three areas.
    Fig. 6. Comparison of net sediment supplies at Xuliujing and the Yangtze River mouth with depositional rates within (a) Area 1, (b) Area 2 and (c) Area 3 during 2002-2009. Specifically, Area 1 represents the mouth bar area (121.78°E-122.34°E, 30.96°N-31.46°N) in Figure 5, Area 2 the submerged delta (121.78°E-122.67°E, 30.82°N- 31.53°N) in Dai et al. (2014a), and Area 3 the large submerged area of the entire Yangtze Estuary downstream of Xuliujing in Chen Y et al. (2018). In addition, the blue numbers represent the net sediment fluxes at Xuliujing and the Yangtze River mouth, whereas the magenta numbers indicate the depositional rates of the three areas.
    Histogram of multi-year average duration days at different levels of river water discharge at Datong during different stages of the construction of major dams on the Yangtze River. The dividing years of 1968, 1981 and 2003 represent the start years of water impoundment of Danjiangkou Dam, Gezhou Dam and Three Gorges Dam (Figure 1a) respectively.
    Fig. 7. Histogram of multi-year average duration days at different levels of river water discharge at Datong during different stages of the construction of major dams on the Yangtze River. The dividing years of 1968, 1981 and 2003 represent the start years of water impoundment of Danjiangkou Dam, Gezhou Dam and Three Gorges Dam (Figure 1a) respectively.
    Variations in sediment sources of (a) the Yangtze River Basin, (b) the Yellow River Delta and (c) the Hangzhou Bay, and the consequent morphological change rate of the entire Yangtze Estuary in the future.
    Fig. 8. Variations in sediment sources of (a) the Yangtze River Basin, (b) the Yellow River Delta and (c) the Hangzhou Bay, and the consequent morphological change rate of the entire Yangtze Estuary in the future.
    TypeNamePeriod(s)Source(s)
    HydrodynamicsDaily river water discharge at Datong1950-2015Changjiang Water Resources Commission
    Residual water level between Xuliujing and the river mouth varying with runoff discharge2005Cai et al., 2014a
    Typhoon in the Yangtze estuarine area1950-2015Dai et al., 2014a; Chen Y et al., 2018; Liu et al., 2019
    SedimentYearly river sediment load at Datong1951-2015Changjiang Water Resources Commission
    Multi-year average net sediment fluxes at Xuliujing and the Yangtze river mouth2002-2009Yang Y P et al., 2014
    Monthly suspended sediment concentrations at Datong and Xuliujing1958-2009Yang Y P et al., 2015
    Yearly suspended sediment concentrations in the Yellow River Delta and the Hangzhou Bay1998-2009Li, 2012;Zhang et al., 2014
    TerrainNavigational charts of the Yangtze Estuary1997, 2002Changjiang Water Resources Commission
    2007Shanghai Estuarine & Coastal Science Research Center
    Multi-year average morphological changing rates of the Yangtze Estuary1958-2002, 2002-2009Dai et al., 2014a
    1958-1983, 1983-1997, 1997-2002, 2002-2009, 2009-2013, 2013-2015Chen Y et al., 2018
    Yearly dredging amount of the Deepwater Channel Project2000-2015Shanghai Estuarine & Coastal Science Research Center
    Multi-year average reclamation rate in the Yangtze Estuary1960-1980, 1980-2000, 2000-2010, 2010-2015Chen L et al., 2018
    Table 1.

    Data sources of this study

    CaseFactor(s) consideredEquationR2
    (1)VEDR = 0.00002V + 0.2770.000
    (2)D≥60,000EDR = -0.123D≥60,000 + 1.6230.077
    (3)SEDR = 0.921S - 1.9820.087
    (4)V and SEDR = -0.002V + 1.184S + 11.3450.112
    (5)D≥60,000 and SEDR = -0.21D≥60,000 + 1.512S - 1.5020.275
    (6)V and D≥60,000EDR = 0.021V - 1.136D≥60,000 - 178.4340.714
    (7)V, D≥60,000 and SEDR = 0.02V - 1.092D≥60,000 + 0.731S - 164.7060.756
    Table 2.

    Linear regressions of erosional/depositional rate of the entire Yangtze Estuary interpreted by river fluxes

    NameTime ((Day. Month. Year)Max. wind power (class)Increased water level at Wusong (m)
    811401.09.198111-121.51
    831027.09.19838-101.17
    861527.08.1986101.12
    891304.08.1989101.11
    971118.08.19978-101.45
    Prapiroon31.08.2000121.38
    Saosmei14.09.200081.29
    Sinlaku08.09.200270.96
    Milei25-26.06.201110
    Meihua06-08.08.201113
    Sula02.08.201212
    Dawei02.08.201212
    Haikui05-08.08.201215
    Bulawan27-28.08.201215
    Tiancheng29-30.08.201212
    Sanba16-17.09.201216
    Feite06-08.10.201314
    Dannasi06-08.10.201314
    Huanxiong07-10.07.201413
    Najili01-03.08.201410
    Bapeng04-06.10.201414
    Huangfeng12.10.201411
    Series of typhoons2015
    Table 3.

    Major typhoons happened in the Yangtze estuarine area over the past 65 years

    Boyuan ZHU, Yitian LI, Yao YUE, Yunping YANG, Enhang LIANG, Chuncai ZHANG, Alistair G. L. BORTHWICK. Alternate erosion and deposition in the Yangtze Estuary and the future change[J]. Journal of Geographical Sciences, 2020, 30(1): 145
    Download Citation