• Journal of Geographical Sciences
  • Vol. 30, Issue 1, 145 (2020)
Boyuan ZHU1、1、1、1、1、1、1、1、1、1、1、1, Yitian LI1、1、1、1、1、1, Yao YUE1、1、1、1、1、1、1、1、1、1、1、1、*, Yunping YANG1、1、1、1、1、1, Enhang LIANG1、1、1、1、1、1, Chuncai ZHANG1、1、1、1、1、1、1、1、1、1、1、1, and Alistair G. L. BORTHWICK1、1、1、1、1、1
Author Affiliations
  • 11School of Hydraulic Engineering, Changsha University of Science & Technology, Changsha 410114, China
  • 12Key Laboratory of Water-Sediment Sciences and Water Disaster Prevention of Hunan Province, Changsha 410114, China
  • 13School of Water Resources and Hydropower Engineering, State Key Laboratory of Water Resources and Hydropower Engineering Science, Wuhan University, Wuhan 430072, China
  • 14Key Laboratory of Engineering Sediment, Tianjin Research Institute for Water Transport Engineering, Ministry of Transport, Tianjin 300456, China
  • 15The Key Laboratory of Water and Sediment Sciences, Ministry of Education; College of Environmental Sciences and Engineering, Peking University, Beijing 100871, China
  • 16School of Engineering, The University of Edinburgh, The King’s Buildings, Edinburgh EH9 3JL, UK
  • show less
    DOI: 10.1007/s11442-020-1720-0 Cite this Article
    Boyuan ZHU, Yitian LI, Yao YUE, Yunping YANG, Enhang LIANG, Chuncai ZHANG, Alistair G. L. BORTHWICK. Alternate erosion and deposition in the Yangtze Estuary and the future change[J]. Journal of Geographical Sciences, 2020, 30(1): 145 Copy Citation Text show less

    Abstract

    The morphological changing trend of the Yangtze Estuary, the largest estuary of Asia, has become a focus of research in recent years. Based on a long series of topographic data from 1950 to 2015, this paper studied the erosion-deposition pattern of the entire Yangtze Estuary. An alternation between erosion and deposition was found during the past 65 years, which was in correspondence to the alternation between flood and dry periods identified by multi-year average duration days of high-level water flow (defined as discharge ≥ 60,000 m 3/s, namely, D≥60,000) from the Yangtze River Basin. A quantitative relationship was further developed between the erosional/depositional rate of the Yangtze Estuary and the interpreting variables of yearly water discharge, D≥60,000 and yearly river sediment load, with contributing rates of 1%, 59% and 40%, respectively. Mechanism behind the alternate erosion and deposition pattern was analyzed by examining residual water surface slope and the corresponding capacity of sediment transport in flood and dry periods. In flood periods, a larger discharge results in steeper slope of residual water level which permits a greater capacity of sediment transport. Therefore, more bed materials can be washed to the sea, leading to erosion of the estuary. In contrast, flatter slope of residual water level occurs in dry periods, and deposition dominates the estuarine area due to the decreased capacity of sediment transport and the increased backwater effect of flood-tide. Coastal dynamics and estuarine engineering projects alter the local morphological changes, but slightly affect the total erosional/depositional rate of the whole estuarine region. Heavy sedimentation within the Yangtze Estuary after the impoundment of the Three Gorges Dam can be attributed to the reduced occurrence frequency of flood years due to water regulation by the dam, and largely (at least 36%-52%) sourced from the sea. Deposition is still possible to occur in the Yangtze Estuary in the future, because the multi-year average D≥60,000 is unlikely to exceed the critical value of 14 days/yr which corresponds to the future equilibrium state of the Yangtze Estuary, under the water regulation of the large cascade dams in the upper Yangtze. Nevertheless, the mean depositional rate will not surpass the peak value of the past years, since the total sediment load entering the Yangtze Estuary has presented a decreasing trend.

    1 Introduction

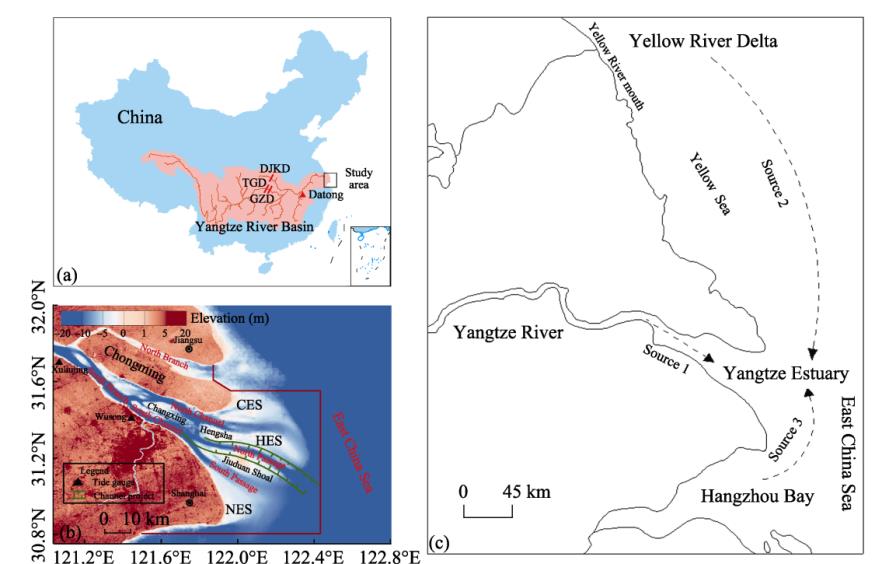
    As the largest estuary of Asia, the Yangtze Estuary is located at the distal end of the Yangtze River (Figure 1a) which ranks the third, fourth and fifth respectively in terms of length, sediment load and water discharge among the world’s rivers (Yang S L et al., 2015). Covering the most prosperous regions in China (namely, Shanghai Municipality and Jiangsu Province) (Figure 1b), the estuarine area of Yangtze provides excellent shipping conditions (Dai et al., 2013) and abundant land resources (Chen et al., 2016), attracting the interest of morphologists of researches from the world.

    Important locations and geographical features of the Yangtze Estuary. (a) Locations of the Datong station, the Three Gorges Dam (TGD), the Gezhou Dam (GZD) and the Danjiangkou Dam (DJKD) within the Yangtze River Basin of China, and the Yangtze Estuary (the study area); (b) plan view of the Yangtze Estuary; CES, HES and NES represent Chongming East Shoal, Hengsha East Shoal and Nanhui East Shoal, respectively; the region enclosed by the red line almost covers the entire Yangtze Estuary downstream of Xuliujing, which is identical to that in Chen Y et al. (2018) providing the major dataset of total erosional/depositional rate in this study; (c) major sediment sources of the Yangtze Estuary.

    Figure 1. Important locations and geographical features of the Yangtze Estuary. (a) Locations of the Datong station, the Three Gorges Dam (TGD), the Gezhou Dam (GZD) and the Danjiangkou Dam (DJKD) within the Yangtze River Basin of China, and the Yangtze Estuary (the study area); (b) plan view of the Yangtze Estuary; CES, HES and NES represent Chongming East Shoal, Hengsha East Shoal and Nanhui East Shoal, respectively; the region enclosed by the red line almost covers the entire Yangtze Estuary downstream of Xuliujing, which is identical to that in Chen Y et al. (2018) providing the major dataset of total erosional/depositional rate in this study; (c) major sediment sources of the Yangtze Estuary.

    Existing studies have widely investigated the impacts of river fluxes, coastal hydrodynamics and human interferences on the subaqueous or subaerial terrain within the Yangtze River Delta, pointing out that different areas have experienced different topographic changes under the influences of various determinant factors in the last few decades. For instances, erosion was found in the area between Datong and Xuliujing (Zheng et al., 2018), between -5 m and -8 m water depths downstream of Xuliujing (Yang et al., 2011), the South Branch (Luan et al., 2016; Zhao et al., 2018), the upper reach of the North Channel (Mei et al., 2018), the adjacent outer area off the North Branch (Luo et al., 2017) and the Yangtze subaqueous delta front (Luo et al., 2017; Yang et al., 2018), mainly due to sediment trapping effect of river dams, constructions of embankments, and management of estuarine channels. However, deposition was detected in the submerged delta ranging from 121.78°E to 122.67°E and from 30.82°N to 31.53°N (Dai et al., 2014a), covering the mouth bar area (including the North Passage, the South Passage and the lower reach of the North Channel) (Dai et al., 2013, 2015; Luan et al., 2016; Li et al., 2018; Mei et al., 2018; Zhao et al., 2018), the North Branch (Dai et al., 2016; Luo et al., 2017) and the tidal flats (Du et al., 2016), primarily due to marine hydrodynamics (e.g., flood tides, storm surges, waves, hyperpycnal plumes, alongshore currents) and human activities (e.g., truncation of peak floods by dams, the Deepwater Channel Project and land reclamation), which offset the effects of reduced river sediment supply by carrying sediment from local places or sea area. In addition, equilibrium was identified in several runnels within the South Branch (Wang et al., 2008, 2013) and at the Jiuduan Shoal (Jiang et al., 2012), dominated by the influences of reduced sediment load from rivers, landward propagation of tidal wave and human interferences. Accordingly, evolutional trends have been predicted to be erosion (Yang et al., 2011; Luan et al., 2017; Luo et al., 2017; Yang et al., 2018), deposition (Dai et al., 2016; Li et al., 2016; Li et al., 2018; Wei et al., 2016, 2017) or equilibrium (Guo et al., 2015; Zhu et al., 2016; Chen Y et al., 2018; Zhao et al., 2018) in different sub-areas in response to the changes of relevant factors.

    Previous efforts have largely enriched our insights into the morphological changes in the Yangtze Estuary from the perspective that the estuary may suffer from erosion, deposition or equilibrium, rather than the unidirectional erosion, even though the river sediment discharge has largely decreased. Moreover, water discharge and sediment load from the river, and tidal current have been indicated as the most determinant factors in the morphological evolution of the Yangtze Estuary. Meanwhile, estuarine engineering projects have extended impacts beyond their given sites. Although the factors of river sediment load, tidal current and estuarine engineering projects have been studied by many researchers (Chen et al., 1982; Wang et al., 2008, 2013; Li et al., 2011; Yang et al., 2011; Dai et al., 2014a, 2016; Luan et al., 2016, 2017; Luo et al., 2017; Chen Y et al., 2018; Mei et al., 2018; Yang et al., 2018; Zhao et al., 2018), river water discharge has not been adequately explored, especially at large scale during long periods (Wang et al., 2013; Guo et al., 2015; Luan et al., 2016; Wei et al., 2016, 2017; Zhu et al., 2017; Mei et al., 2018; Zhang et al., 2018). In particular, how the hydrological behavior of periodic alternations between flood and dry periods of the Yangtze River Basin will affect large-scale morphological changes of the estuary needs to be answered, which will give light to the long-term evolution of the Yangtze Estuary in the future. In addition, sediment flux coming from the sea may also affect the evolutional trend of morphology (Dai et al., 2014a, 2016; Chen Y et al., 2018; Mei et al., 2018). However, existing predictions have mainly based on the long-term variation of the river sediment discharge (Yang et al., 2011; Luan et al., 2017; Luo et al., 2017; Yang et al., 2018). Thus, long-term changing trends of both marine and riverine supplies of sediment should also be dissected to get an overall perception into the future evolution of the Yangtze Estuary.

    In order to provide a better understanding of the connection between the river water discharge and the large scale evolution of the Yangtze Estuary during long period, this study investigated the variations in total erosion and deposition during different hydrological periods based on terrain data of the submerged delta of the entire estuary collected from 1950 to 2015. A quantitative relationship between erosional/depositional rate and river fluxes has been developed and the mechanism behind morphological evolution patterns in relation with hydrological cycles has been further investigated. In addition, the long-term changing trends of both riverine and marine sediment sources have also been analyzed. Thus, future evolution in morphology of the Yangtze Estuary can be fairly predicted. This study is also of significance to other estuaries experiencing great changes in riverine hydrological processes and sediment supplies from either river basins or sea area.

    2 Geographical setting

    The Yangtze Estuary downstream of Xuliujing stretches 180 km from west to east and 6-90 km from north to south at the tail end of the Yangtze River (Figure 1a), where the channels present a three-fold bifurcating structure (Figure 1b): at Chongming Island, the river forms the first fold of bifurcation dividing into the North Branch and the South Branch; the South Branch then bifurcates at Changxing and Hengsha Island and branches as the North Channel and the South Channel; the South Channel again splits at the Jiuduan Shoal, forming the North Passage and the South Passage. At the mouth area, there are three large tidal flats named Chongming East Shoal (CES), Hengsha East Shoal (HES) and Nanhui East Shoal (NES) from north to south (Figure 1b). The Yangtze Estuary is meso-tidal with a mean tide range of 2-3 m and a flow velocity of about 1 m/s (Li et al., 2011; Zhang et al., 2016), receiving the water and sediment from both of the river and the sea. The annual average river water discharge is about 28,300 m3/s at Datong station (thereafter Datong) (CWRC, 2015), the last hydrological station (~500 km upstream from the estuary, see Figure 1a) which keeps long-term water and sediment discharge records of the river basin and is usually regarded as the representative station for the river fluxes into the estuary (Yang et al., 2011; Dai et al., 2014a; Luan et al., 2016, 2017; Zhu et al., 2017; Fu, 2018; Mei et al., 2018; Yang et al., 2018; Zhao et al., 2018). In comparison, the annual average flood-tide current is approximately 9 times larger than the river discharge (Chen and Li, 2002). The annual average river sediment load observed at Datong has decreased drastically from 4.25×10⁸ t/yr during 1951-2002 to 1.39×10⁸ t/yr during 2003-2015 due to the construction of dams and the implementation of soil conservation measures within the river basin (CWRC, 2015; Fu, 2018). In addition to sediment from the river basin, sediment from the sea is supplied from three sources, i.e., the sediment carried by longshore current from the Yellow River Delta, the material brought by littoral flow from the Hangzhou Bay, and the earlier storage within the offshore area transported by river water from the watershed (Lin, 1988). For simplicity, the third source of marine sediment is also regarded as from the Yangtze River Basin. All the possible pathways of sediment supplies to the Yangtze Estuary are shown in Figure 1c.

    3 Data and methods

    3.1 Data sources

    Observed daily water discharge and yearly sediment load time series from 1950 to 2015 at Datong were supplied by the Changjiang Water Resources Commission (CWRC), China. Multi-year average morphological changing rate of the large submerged delta of the Yangtze Estuary during 1958-2015 can be reflected by data from published literatures (Dai et al., 2014a; Chen Y et al., 2018) or navigational charts of the Yangtze Estuary in 1997, 2002 and 2007 provided by the CWRC, and the Shanghai Estuarine & Coastal Science Research Center, China (SECSRC). Yearly dredging amount of the Deepwater Channel Project was obtained from the SECSRC. In addition, other supportive data of water, typhoon, sediment and reclamation were also collected from previous researches: (1) residual water level between Xuliujing and the river mouth varying with runoff discharge in 2005 (Cai et al., 2014a); (2) major typhoon events happened in the Yangtze estuarine area during 1950-2015 (Dai et al., 2014a; Chen Y et al., 2018; Liu et al., 2019); (3) multi-year mean net sediment fluxes at Xuliujing and the river mouth during 2002-2009 (Yang Y P et al., 2014); (4) monthly suspended sediment concentrations at Datong and Xuliujing during 1958-2009 (Yang Y P et al., 2015); (5) yearly suspended sediment concentrations in the Yellow River Delta and the Hangzhou Bay during 1998-2009 (Li, 2012; Zhang et al., 2014); (6) multi-year average reclamation rate in the Yangtze Estuary during 1960-2015 (Chen L et al., 2018). All the data sources of this study are summarized in Table 1.

    TypeNamePeriod(s)Source(s)
    HydrodynamicsDaily river water discharge at Datong1950-2015Changjiang Water Resources Commission
    Residual water level between Xuliujing and the river mouth varying with runoff discharge2005Cai et al., 2014a
    Typhoon in the Yangtze estuarine area1950-2015Dai et al., 2014a; Chen Y et al., 2018; Liu et al., 2019
    SedimentYearly river sediment load at Datong1951-2015Changjiang Water Resources Commission
    Multi-year average net sediment fluxes at Xuliujing and the Yangtze river mouth2002-2009Yang Y P et al., 2014
    Monthly suspended sediment concentrations at Datong and Xuliujing1958-2009Yang Y P et al., 2015
    Yearly suspended sediment concentrations in the Yellow River Delta and the Hangzhou Bay1998-2009Li, 2012;Zhang et al., 2014
    TerrainNavigational charts of the Yangtze Estuary1997, 2002Changjiang Water Resources Commission
    2007Shanghai Estuarine & Coastal Science Research Center
    Multi-year average morphological changing rates of the Yangtze Estuary1958-2002, 2002-2009Dai et al., 2014a
    1958-1983, 1983-1997, 1997-2002, 2002-2009, 2009-2013, 2013-2015Chen Y et al., 2018
    Yearly dredging amount of the Deepwater Channel Project2000-2015Shanghai Estuarine & Coastal Science Research Center
    Multi-year average reclamation rate in the Yangtze Estuary1960-1980, 1980-2000, 2000-2010, 2010-2015Chen L et al., 2018

    Table 1.

    Data sources of this study

    3.2 Processing of river water discharge

    The number of days in which the discharge exceeded or equaled 60,000 m3/s (thereafter D≥60,000) was counted for each of the years from 1950 to 2015, based on the time series of daily water discharge at Datong, to reflect the severity of fluvial flood events of the year. Herein, 60,000 m3/s was adopted as a critical discharge because it is the level of multi-year average peak-flood discharge over 1950-2015 at Datong (58,300 m3/s), and also approaches the effective/bankfull discharge (60,400 m3/s) (Yun, 2004; Luan et al., 2016) of the Yangtze Estuary, which was regarded as the dominant discharge required for significant bed-level changes (Andrews, 1980; Emmett and Wolman, 2001; Yun, 2004; Gomez et al., 2007; Xia et al., 2014; Luan et al., 2016). Moreover, annual mean duration days of different discharge levels were also calculated to depict the variability of river water discharge within the concerned period.

    3.3 Processing of navigational charts

    In addition to the data of morphological changing rate of the Yangtze Estuary directly excerpted from published literatures, three sets of navigational charts which were surveyed in periods starting from between early May and early June to the end of July in 1997, 2002 and 2007 have also been collected. To process these charts, an automatic transfer from their original projections onto Beijing 54 coordinates was conducted using ArcGIS 10.2, with reference to the theoretical low-tide datum at Wusong (Figure 1b) during the digitization. Bed-elevations and positions of the points in the charts were acquired using dual-frequency echo sounders and GPS positioning, respectively. The errors of measurements are ±0.1 m for bed-elevation, and ±1 m for position, which are generally acceptable, given that the bed-elevation changes over decades can be very huge, making the relative error very small (Luan et al., 2016). The average density of sample is 3-12 points per km2 (i.e., space of 0.3-0.6 km between two neighboring points), which appears sufficiently representative because the terrain changes over kilometers of the Yangtze Estuary are usually gradual (Wang et al., 2008). Thus, the terrain changes were calculated by means of Kriging interpolation at grid resolution of 160 m × 120 m. It should be noted that the present study explores the overlapping area of the three sets of navigational charts extending from 121.78°E to 122.34°E and from 30.96°N to 31.46°N, for comparison of morphological changes among the years.

    4 Results and discussion

    4.1 Alternate erosion and deposition during flood and dry periods

    Figure 2a shows that three erosion-deposition cycles have revisited the submerged area marked by red line in Figure 1b. Cycle 1 started with erosion around 1954, and followed by heavy deposition during 1958-1983 and erosion-deposition equilibrium during 1983-1997. Cycle 2 consisted of erosion during 1997-2002 and deposition during 2002-2009. Cycle 3 is presented as severe erosion during 2009-2013 and heavy deposition during 2013-2015. It should be noted that, the phenomenon of erosion around 1954 was supported by Wu et al. (2003) , Yun (2004) and He et al. (2013) which reported erosion in the Yangtze mouth bar area and the formation of the North Passage, even though no topographic data was available before 1958.

    Comparison between morphological and hydrological processes in the Yangtze Estuary. (a) Histogram of erosional/depositional rates (positive values indicating deposition, and negative ones representing erosion) of the marked submerged area (Figure 1b) in the periods of 1950-1958, 1958-1983, 1983-1997, 1997-2002, 2002-2009, 2009-2013 and 2013-2015, respectively; dashed arrow during 1950-1958 represents an erosional state of the marked submerged area and red-bold line segment over 1983-1997 stands for an equilibrium state. (b) Yearly river water discharge, D≥60,000 and yearly and multi-year average river sediment load at Datong from 1950 to 2015.

    Figure 2. Comparison between morphological and hydrological processes in the Yangtze Estuary. (a) Histogram of erosional/depositional rates (positive values indicating deposition, and negative ones representing erosion) of the marked submerged area (<xref ref-type="fig" rid="F1">Figure 1</xref>b) in the periods of 1950-1958, 1958-1983, 1983-1997, 1997-2002, 2002-2009, 2009-2013 and 2013-2015, respectively; dashed arrow during 1950-1958 represents an erosional state of the marked submerged area and red-bold line segment over 1983-1997 stands for an equilibrium state. (b) Yearly river water discharge, <italic>D</italic><sub>≥60,000</sub> and yearly and multi-year average river sediment load at Datong from 1950 to 2015.

    Figure 2b illustrates that the yearly river water discharge from 1950 to 2015 had not exhibited obvious trend, whereas the yearly river sediment load has decreased significantly since 1985. By comparison with the erosion and deposition series in Figure 2a, it can be found that each of the erosion and deposition cycle in the marked submerged area commenced in a flood period (i.e., the period which had the higher value of D≥60,000. The three flood periods contained typical flood years of 1954, 1998 (1999) and 2010, respectively.) In other words, erosion co-occurred with flood periods, and immediately alternated with deposition in dry periods.

    Compared with previous studies which observed episodic cycles of erosion during extreme flood periods and readjustments during following dry periods occurred in component regions within the Yangtze Estuary (Mei et al., 2018) and within other estuarine systems (Cooper, 2002), this study implies that such cycles can also happen in an entire estuarine area.

    4.2 Mechanism behind erosion-deposition alternation

    4.2.1 Quantitative relationship between erosional/depositional rate and river fluxes

    Linear regression equations linking the erosional/depositional rate of the entire Yangtze Estuary and interpreting variables of the yearly river water discharge, the D60,000 and the yearly river sediment load are listed in Table 2, which are derived from the data in Figure 2. It is found that the erosional/depositional rate loosely correlates with one single factor (Eqs. 1-3), but tightly correlates with multiple factors (Eqs. 4-7), especially with the combination of yearly river water discharge and D≥60,000 (Eqs. 6 and 7). While the yearly river sediment load is added, the correlation is further improved (Eq. 7). Moreover, the coefficients before yearly river water discharge and yearly river sediment load in Equation 7 are positive, suggesting that heavier deposition will occur as the two variables increase, given that more yearly river water discharge carries more yearly river sediment load. In contrast, the coefficient before D≥60,000 is negative, leading to more severe erosion when D≥60,000 increases. Since Equation 7 shows reasonable relationship between water-sediment conditions and morphological change, it is adopted in this study.

    CaseFactor(s) consideredEquationR2
    (1)VEDR = 0.00002V + 0.2770.000
    (2)D≥60,000EDR = -0.123D≥60,000 + 1.6230.077
    (3)SEDR = 0.921S - 1.9820.087
    (4)V and SEDR = -0.002V + 1.184S + 11.3450.112
    (5)D≥60,000 and SEDR = -0.21D≥60,000 + 1.512S - 1.5020.275
    (6)V and D≥60,000EDR = 0.021V - 1.136D≥60,000 - 178.4340.714
    (7)V, D≥60,000 and SEDR = 0.02V - 1.092D≥60,000 + 0.731S - 164.7060.756

    Table 2.

    Linear regressions of erosional/depositional rate of the entire Yangtze Estuary interpreted by river fluxes

    According to Equation 7, the yearly river water discharge, D≥60,000 and yearly river sediment load contribute 1%, 59% and 40% (obtained through the divisions of the absolute values of the coefficients before the interpreting variables by the sum of the absolute values), respectively, to the erosional/depositional rate, which indicates that D≥60,000 and yearly river sediment load play the dominant and secondary roles separately in the morphological alternations of the entire Yangtze Estuary.

    Using Equation 7 to calculate the erosional/depositional rates of the entire Yangtze Estuary in 1954, 1998 (1999) and 2010 based on corresponding values of yearly river water discharge, D≥60,000 and yearly river sediment load in Figure 2b, the results are -7.44×10⁸ t/yr, -9.37×10⁸ t/yr (-13.85×10⁸ t/yr) and -1.10×10⁸ t/yr, respectively, demonstrating that the flood events in these years could generally cause significant erosion and led to the overall erosion in relevant periods (Figure 2a). However, the calculated erosional rate in 2010 is much smaller than that during the relevant period of 2009-2013; this is because the yearly river sediment load in 2011 was very low (Figure 2b), making the erosional rate very large (-30.76×10⁸ t/yr, calculated using Eq. 7) in this year and enlarging the multi-year average value of erosional rate during 2009-2013. Although the values of D≥60,000 decrease sequentially in 1954, 1998 and 1999 (Figure 2b), the calculated erosional rates increase orderly, which is also related to the successive decrease of the yearly river sediment loads in these three years (Figure 2b). These phenomena indicate the impact of yearly river sediment load in the morphological evolution of the entire Yangtze Estuary.

    4.2.2 Confrontation between runoff and tide

    Given that D≥60,000 acts as the dominant factor in controlling the erosion-deposition alternation of the entire Yangtze Estuary, the mechanism behind the hydrology-morphological process can be revealed through an in-depth analysis on the hydrodynamic changes.

    Runoff and tide are two major hydrodynamic drivers in the morphological processes of estuaries. There is an obvious confrontation between the two drivers given that they flow seaward and landward respectively, and the situation of confrontation is mainly determined by river water discharge, considering the relative stability of flood-tide current in estuaries at a yearly time scale (Jiang et al., 2012; Zhu et al., 2017).

    According to existing theories on the mechanism behind the interactions among the major constituents of runoff and tide, residual water surface slope is vital in the transformation between erosion and deposition in estuaries (Lamb et al., 2012; Nittrouer et al., 2012; Chatanantavet and Lamb, 2014; Cai et al., 2014a, 2014b, 2016, 2018). Steep slope of residual water level forms when river water discharge is high (Figure 3), which promotes large transportation of bed materials into the sea, leading to erosion in estuarine areas by inducing high seaward velocities. Conversely, flat slope of residual water level appears with low river water discharge (Figure 3), which triggers small seaward velocities and relatively strengthens the backwater effect of flood-tide, facilitating sediment settlings as well as landward transports of marine sediment, and thus, producing depositional features.

    Residual water level changing with distance upstream from the Yangtze River mouth with varying monthly river water discharge in 2005.

    Figure 3. Residual water level changing with distance upstream from the Yangtze River mouth with varying monthly river water discharge in 2005.

    The classical Zhang’s Formula of sediment transport capacity, which is widely accepted by researchers to calculate the capacity of water to carry sediment in rivers (Tan et al., 2018), can be used to further interpret the mechanism under high and low river water discharges. Although the formula may need to consider marine influences when using in estuarine areas, as many researchers have done over the past years (Xie and Yan, 2011; Mo et al., 2012; Hu et al., 2018), the main terms of the modified forms are still similar to the original Zhang’s Formula. In addition, since we are mainly concerning the sediment transport capacity of river water discharge here, it is acceptable to employ the original Zhang’s Formula to simplify the deduction. The Zhang’s Formula is written as:

    where k (kg/m3) and m (-) are parameters with positive values calibrated using the observed data; g (m/s2) is the acceleration of gravity; ω (m/s) is the settling velocity of sediment; U (m/s) and R (m) are depth-averaged river water flow velocity and hydraulic radius respectively.

    Considering the Manning’s formula which reflects the inherent relations among hydrodynamic factors in natural rivers (Hergarten and Neugebauer, 1997; Huang, 2007; Bao et al., 2011):

    Equation 8 can be re-written as:

    where n (-) is roughness coefficient of the river bed, which is also a parameter with positive value, and J (-) is the water surface slope. Since R in Equation 10 can be approximately substituted by water depth (h in m) in natural rivers where channel widths are usually far larger than the water depths (Chai et al., 2004), Equation 10 is also expressed as:

    The parameters of k, m and n are calibrated from observed data, and are usually with constant values at fixed positions; and ω is highly related to the physio-chemical characteristics of sediment (Tan et al., 2018). Therefore, S* is mainly determined by the term hJ3/2. As Figure 3 shows, high river water discharge is accompanied by high values of h and J, and therefore resulted in a high value of S*, which means large sediment transport to the sea. Similarly, low river water discharge corresponds to opposite situation.

    Consequently, the alternate erosion and deposition in the Yangtze Estuary can be interpreted by the mechanism of interaction between runoff and tide. Since the peak values of monthly discharge of the three flood periods (before 1958, 1997-2002 and 2009-2013) reached 84,200 m3/s, 77,100 m3/s, and 61,400 m3/s respectively, it can be speculated from Figure 3 and Equation 11 that the slopes of residual water levels, water depths and S* in these periods should be very large; therefore, erosion has been generated in the entire estuary. In contrast, the following dry periods came with low slopes of residual water levels, water depths and S*, and obvious backwater effects, thus experiencing deposition.

    4.2.3 Impacts of other factors

    Other than river fluxes and tidal currents, the Yangtze Estuary may also be affected by coastal dynamics (mainly waves, sea level rise and typhoons) and estuarine engineering projects (mainly Xuliujing Node narrowing, Deepwater Channel Project and land reclamation).

    (1) Coastal dynamics

    According to existing studies (Wang et al., 2008, 2013), waves and sea level rise exert very limited impacts on the morphology of the Yangtze Estuary due to the rapid decay during the course of reaching the estuary mouth and the little influences on the hydrodynamic-morphological changes respectively. Therefore, the impact of typhoon is mainly discussed here.

    Typhoon acts as a random forcing factor, which triggers storm surges and causes severe erosional or depositional changes in estuaries (Dai et al., 2014a; Du et al., 2019). When comparing the magnitudes (classes and increased water levels) of the typhoons that happened in the Yangtze estuarine area over the past 65 years (Table 3) with the erosional/depositional rates of the entire Yangtze Estuary during corresponding historical periods (Figure 2a), it can be perorated that typhoon is not a controlling factor in the morphological alternation. In details, there was no obvious difference among the average magnitudes of typhoons before 1983, during 1983-1997 and 1997-2002, however, the erosional/depositional rates of the entire Yangtze Estuary varied conspicuously over the three periods. The similar situation also happened between the periods of 2009-2013 and 2013-2015 (Table 3 and Figure 2a). Nonetheless, consecutive typhoon events in short time might incur remarkable changes in morphology, such as the case that the series of typhoons in 2015 strengthened the flood-tide-driven sediment transport scoured from the offshore deep-water zone and promoted the heavy deposition in the Yangtze Estuary during 2013-2015 (Figure 2a) (Chen Y et al., 2018).

    NameTime ((Day. Month. Year)Max. wind power (class)Increased water level at Wusong (m)
    811401.09.198111-121.51
    831027.09.19838-101.17
    861527.08.1986101.12
    891304.08.1989101.11
    971118.08.19978-101.45
    Prapiroon31.08.2000121.38
    Saosmei14.09.200081.29
    Sinlaku08.09.200270.96
    Milei25-26.06.201110
    Meihua06-08.08.201113
    Sula02.08.201212
    Dawei02.08.201212
    Haikui05-08.08.201215
    Bulawan27-28.08.201215
    Tiancheng29-30.08.201212
    Sanba16-17.09.201216
    Feite06-08.10.201314
    Dannasi06-08.10.201314
    Huanxiong07-10.07.201413
    Najili01-03.08.201410
    Bapeng04-06.10.201414
    Huangfeng12.10.201411
    Series of typhoons2015

    Table 3.

    Major typhoons happened in the Yangtze estuarine area over the past 65 years

    (2) Estuarine engineering projects

    Since the 1960s, the upstream node of the Yangtze Estuary, the Xuliujing Node, has been roughly stable with a width of about 5.7 km under human interferences induced narrowing around the site (Yun, 2004; Wang et al., 2013), thus should have not produced notable impacts on river fluxes and morphological evolution in the Yangtze Estuary over the periods concerned in this study. The major engineering projects implemented in recent 65 years are the Deepwater Channel Project and the land reclamation.

    The Deepwater Channel Project was implemented in 1998 in the North Passage (Figure 1b). Although this project has been associated with serious back-siltation in its vicinity, primarily in the North Passage (Luan et al., 2016; Li et al., 2018; Zhao et al., 2018), the deposition has only become notable after 2004 and has experienced upward and downward courses respectively before and after 2010, which has been reflected by the variation of yearly dredging amount during 2000-2015 (Figure 4a). Therefore, the back-siltation induced by the channel project has not kept pace with the erosion-deposition alternation of the entire Yangtze Estuary (Figure 2a) and is unlikely to be a dominant factor. More precisely, the project-induced multi-year average depositional rate in the North Passage during 2009-2013 was much larger than those during 2002-2009 and 2013-2015 (Figure 4a), but the entire Yangtze Estuary underwent severe erosion during 2009-2013 while experienced deposition during the other two periods (Figure 4a).

    Land reclamation has mainly implemented on the tidal flats and along the North Branch (Figure 1b) (Dai et al., 2016; Chen L et al., 2018; Su and Fan, 2018; Teng et al., 2019). Total reclamation over these areas during different periods (Figure 4b) has surely contributed to the deposition of the Yangtze Estuary in comparative periods (Figure 2a). Nevertheless, reclamation has not determined the erosion-deposition alternation, because the reclamation rates during certain periods have not shown good positive correlations with the erosional/depositional rates of the entire Yangtze Estuary during the comparative periods (Figure 4b). Hence, reclamation is also not the determinant factor in the morphological alternation of the entire Yangtze Estuary.

    Yearly dredging amount of the Deepwater Channel Project from 2000 to 2015 (a) and multi-year average reclamation rates over the whole Yangtze Estuary during the periods of 1960-1980, 1980-2000, 2000-2010 and 2010-2015 (b) and erosional/depositional rates (positive values indicating deposition, and negative ones representing erosion) of the entire Yangtze Estuary during the comparative periods ((a) and (b)).

    Figure 4. Yearly dredging amount of the Deepwater Channel Project from 2000 to 2015 (a) and multi-year average reclamation rates over the whole Yangtze Estuary during the periods of 1960-1980, 1980-2000, 2000-2010 and 2010-2015 (b) and erosional/depositional rates (positive values indicating deposition, and negative ones representing erosion) of the entire Yangtze Estuary during the comparative periods ((a) and (b)).

    In summary, neither the coastal dynamics nor the estuarine engineering projects play the dominant role in the erosion-deposition alternation of the entire Yangtze Estuary.

    4.3 Post-TGD deposition

    After the impoundment of the Three Gorges Dam (i.e. the post-TGD period), heavy deposition within the Yangtze Estuary has been reported by various researches. For instances, Dai et al. (2014a) found that a high depositional rate of 229×106 m3/yr has occurred in the submerged delta (121.78°E-122.67°E, 30.82°N-31.53°N) of the Yangtze Estuary during the post-TGD period of 2002-2009, which was about twice as large as the rate of 118×106 m3/yr during the pre-TGD period of 1958-2002. Chen Y et al. (2018) also indicated that high depositional rates during post-TGD periods of 2002-2009 and 2013-2015 have taken place in a large submerged area (containing the marked area in Figure 1b) from Xuliujing to the delta front in the Yangtze Estuary.

    Under the framework interpreting the mechanism of the alternate pattern of erosion-deposition, such heavy deposition during the post-TGD period was mainly resulted from the significant cutting-down of flood peaks due to the impoundment of TGD (Zhu et al., 2017; Fu, 2018; Mei et al., 2018). Since the occurrence frequency of low flow discharges has increased, the residual water surface slope has been flattened, resulting in lower S* and more obvious backwater effect in the Yangtze Estuary, and finally noteworthy deposition. Figure 5 shows the distribution of bed-elevation changing rates in the Yangtze mouth bar area (121.78°E-122.34°E, 30.96°N-31.46°N) during the post-TGD dry period of 2002-2007 in comparison with the pre-TGD flood period of 1997-2002. It can be found that the overall bed-elevation depositional rate increased obviously from the pre-TGD flood period to the post-TGD dry period, which is in correspondence with a shift of D≥60,000 (from 29 days/yr to 4 days/yr). It is shown in Figure 5b that the Deepwater Channel Project has affected the erosion-deposition pattern around the site, such as the obvious deposition along the two sides of the North Passage and the upper-reach erosion and lower-reach deposition in the South Passage, even though the channel project does not determine the overall morphological evolution of the Yangtze Estuary.

    Spatial distribution of bed-elevation changing rates (positive values indicating deposition, and negative ones representing erosion) in the Yangtze mouth bar area (121.78°E-122.34°E, 30.96°N-31.46°N) during the periods of (a) 1997-2002 and (b) 2002-2007

    Figure 5. Spatial distribution of bed-elevation changing rates (positive values indicating deposition, and negative ones representing erosion) in the Yangtze mouth bar area (121.78°E-122.34°E, 30.96°N-31.46°N) during the periods of (a) 1997-2002 and (b) 2002-2007

    Figure 6 illustrates the sediment budget of the Yangtze Estuary during the post-TGD period from 2002 to 2009. Even though we assume that all the sediment load from Xuliujing deposited within the three areas marked by dashed lines in Figure 6, it only contributes 48%-64% of the deposition to these areas. If deposition from the seaward sediment flux (i.e., 0.46×10⁸ t/yr implied in Figure 6) in area between Xuliujing and the river mouth is taken into account, such rate (i.e. 48%-64%) is obviously overestimated. That is to say, the contribution of marine source brought by the flood-tide to the post-TGD heavy deposition was at least 36%-52%. Similarly, sediment load from Xuliujing during 2013-2015 was extremely low, also implying a great contribution from the marine source to Area 3 (Figure 6c) where heavy deposition occurred in the corresponding period (Chen Y et al., 2018). It should be noted that there was no directly observed data of sediment load at Xuliujing during 2013-2015; however, a positive relation has been found between sediment load at Datong and that at Xuliujing (Yang Y P et al., 2015), and the low sediment supply from Xuliujing during 2013-2015 could be fairly reflected by that from Datong (Figure 2b). Previous researches (Liu et al., 2011; Li et al., 2019) have also shown that the sediment in the Yangtze Estuary comes from both the river and the sea through analyses on the particle sizes of bed materials and have suggested that the available fine sediment supplied to the estuary from the offshore area is abundant, largely supporting the verdicts here.

    Comparison of net sediment supplies at Xuliujing and the Yangtze River mouth with depositional rates within (a) Area 1, (b) Area 2 and (c) Area 3 during 2002-2009. Specifically, Area 1 represents the mouth bar area (121.78°E-122.34°E, 30.96°N-31.46°N) in Figure 5, Area 2 the submerged delta (121.78°E-122.67°E, 30.82°N- 31.53°N) in Dai et al. (2014a), and Area 3 the large submerged area of the entire Yangtze Estuary downstream of Xuliujing in Chen Y et al. (2018). In addition, the blue numbers represent the net sediment fluxes at Xuliujing and the Yangtze River mouth, whereas the magenta numbers indicate the depositional rates of the three areas.

    Figure 6. Comparison of net sediment supplies at Xuliujing and the Yangtze River mouth with depositional rates within (a) Area 1, (b) Area 2 and (c) Area 3 during 2002-2009. Specifically, Area 1 represents the mouth bar area (121.78°E-122.34°E, 30.96°N-31.46°N) in <xref ref-type="fig" rid="F5">Figure 5</xref>, Area 2 the submerged delta (121.78°E-122.67°E, 30.82°N- 31.53°N) in Dai <italic>et al.</italic> (2014a), and Area 3 the large submerged area of the entire Yangtze Estuary downstream of Xuliujing in Chen Y <italic>et al</italic>. (2018). In addition, the blue numbers represent the net sediment fluxes at Xuliujing and the Yangtze River mouth, whereas the magenta numbers indicate the depositional rates of the three areas.

    4.4 Future morphological change

    Since 1950, more than 50,000 dams have been constructed in the Yangtze River Basin (Yang et al., 2011). Under the operation of these dams, the seasonal distribution of runoff discharge has been smoothed, mainly performing as the decreases of the multi-year average duration days of the discharge levels <10,000 m3/s and >50,000 m3/s and the increase of that of the discharge level 10,000-20,000 m3/s (Figure 7). In particular, D≥60,000 decreased to 3 days/yr during the post-TGD period of 2003-2015. According to the existing studies (EGSP/OTGPCC, 2002; Yang S L et al., 2007, 2014), the future multi-year average river sediment load entering into the Yangtze Estuary will not surpass 1.5×10⁸ t/yr within a long term (>300 years). If this limitation of sediment load is adopted and the multi-year average runoff volume is employed as 8923×108 m3/yr (average value of 1950-2015), the critical D≥60,000 related to the morphological equilibrium of the entire Yangtze Estuary is deduced as 14 days/yr using Equation 7, which is significantly larger than 3 days/yr during 2003-2015. At the time of writing, a cascade of large dams is consecutively under construction along the upper Yangtze, leading to continuous “smoothing” of the river water discharge due to the water regulation (Duan et al., 2016). Therefore, it is not likely that the multi-year average D≥60,000 will exceed 14 days/yr in the future. Consequently, the residual water surface slope will be further flattened, resulting in lower S* and more significant backwater effect in the Yangtze Estuary. Hence, deposition is still possible to occur in the Yangtze Estuary, especially under the condition that the sediment supply from the offshore area is abundant around the same period of “smoothing”.

    Histogram of multi-year average duration days at different levels of river water discharge at Datong during different stages of the construction of major dams on the Yangtze River. The dividing years of 1968, 1981 and 2003 represent the start years of water impoundment of Danjiangkou Dam, Gezhou Dam and Three Gorges Dam (Figure 1a) respectively.

    Figure 7. Histogram of multi-year average duration days at different levels of river water discharge at Datong during different stages of the construction of major dams on the Yangtze River. The dividing years of 1968, 1981 and 2003 represent the start years of water impoundment of Danjiangkou Dam, Gezhou Dam and Three Gorges Dam (<xref ref-type="fig" rid="F1">Figure 1</xref>a) respectively.

    Nonetheless, the mean depositional rate of the entire Yangtze Estuary highly depends on the change in the total sediment flux from the three sources, i.e., the Yangtze River Basin, the Yellow River Delta and the Hangzhou Bay. The sediment supply from the Yangtze River has presented a declining trend due to the construction of dams and the implementation of soil conservation measures within the river basin (Yang et al., 2011; Luo et al., 2017; Yang et al., 2018), reflected by the decreased suspended sediment concentrations at Datong and Xuliujing (Figure 8a). Similarly, the sediment supply from the Yellow River Delta has also experienced decreasing trend because of the Water-Sediment Regulation Scheme using dams in the basin which has reduced the river-to-sea sediment load of the Yellow River (Chu, 2014; Tan et al., 2016). Such reduction can be reflected by the decreases in suspended sediment concentrations of the Yellow River mouth and the Laizhou Bay since 2003 (Figure 8b). In addition, the sediment supply from the Hangzhou Bay has reduced as well, since suspended sediment concentrations at the gauge stations in the bay have decreased after 2002 (Figure 8c), mainly due to the construction of dams and sluices on the rivers discharging sediment into the bay (Zeng, 2010; Li, 2012; Dai et al., 2014b). Since sediment fluxes from the three sources into the Yangtze Estuary have all presented decreasing trends, it implies that the mean depositional rate of the entire Yangtze Estuary is not likely to exceed the peak value of the past years.

    Variations in sediment sources of (a) the Yangtze River Basin, (b) the Yellow River Delta and (c) the Hangzhou Bay, and the consequent morphological change rate of the entire Yangtze Estuary in the future.

    Figure 8. Variations in sediment sources of (a) the Yangtze River Basin, (b) the Yellow River Delta and (c) the Hangzhou Bay, and the consequent morphological change rate of the entire Yangtze Estuary in the future.

    5 Conclusions

    The present study shows that alternations between erosion and deposition have occurred in the entire Yangtze Estuary under the hydrological cycles between flood and dry periods in the river basin over the past 65 years. In other words, erosion came with flood events and deposition followed with dry flows. It is demonstrated that erosional/depositional rate of the entire Yangtze Estuary has high quantitative relationship with yearly river water discharge, D≥60,000 and yearly river sediment load, with the contributing rates of 1%, 59% and 40%, respectively. The morphology-hydrology process can be further interpreted using residual water surface slope and the corresponding sediment transport capacity. Coastal dynamics and estuarine engineering projects alter the local morphological changes, but slightly affect the total erosional/depositional rate of the whole estuarine region. The post-TGD heavy deposition within the Yangtze Estuary can be attributed to the truncation on flood peaks due to water regulation by TGD, and the sediment source is largely (at least 36%-52%) from the sea and being carried by flood-tide. The critical D≥60,000 corresponding to the future equilibrium state of the Yangtze Estuary approximates 14 days/yr. However, the future multi-year average D≥60,000 is unlikely to exceed this value as river water discharge will be continuously smoothed by the cascade of large dams along the upper Yangtze. Therefore, deposition is still possible to occur in the Yangtze Estuary. However, the mean depositional rate will not exceed the peak value of the past, because sediment loads from all the three sources, i.e., the Yangtze River Basin, the Yellow River Delta and the Hangzhou Bay have presented decreasing trends. The findings of this study also have implications to other estuaries which are experiencing great riverine hydrological changes and sediment exchanges with both their own drainage basins and the adjacent estuaries, especially under such an age of dramatic climate variations and widespread dam constructions.

    References

    [1] D Andrews E. Effective and bankfull discharges of streams in the Yampa River Basin, Colorado and Wyoming. Journal of Hydrology, 46, 311-330(1980).

    [2] M Bao W, Q Zhang X, B Yu Z et al. Real-time equivalent conversion correction on river stage forecasting with Manning’s Formula. Journal of Hydrological Engineering, 16, 1-9(2011).

    [3] Y Cai H, G Savenije H H, J Jiang C. Analytical approach for predicting fresh water discharge in an estuary based on tidal water level observations. Hydrology and Earth System Sciences, 18, 4153-4168(2014).

    [4] Y Cai H, G Savenije H H, M Toffolon. Linking the river to the estuary: Influence of river discharge on tidal damping. Hydrology and Earth System Sciences, 18, 287-304(2014).

    [5] Y Cai H, G Savenije H H, J Jiang C et al. Analytical approach for determining the mean water level profile in an estuary with substantial fresh water discharge. Hydrology and Earth System Sciences, 20, 1177-1195(2016).

    [6] Y Cai H, S Yang Q, H Zhang Z et al. Impact of river-tide dynamics on the temporal-spatial distribution of residual water level in the Pearl River channel networks. Estuaries & Coasts, 2018, 1-19(2018).

    [7] C Chai J, N Miura, T Nomura. Effect of hydraulic radius on long-term drainage capacity of geosynthetics drains. Geotextiles Geomembranes, 22, 3-16(2004).

    [8] . Changjiang River Sediment Bulletin(2015).

    [9] P Chatanantavet, P Lamb M. Sediment transport and topographic evolution of a coupled river and river plume system: An experimental and numerical study. Journal of Geophysical Research - Earth Surface, 119, 1263-1282(2014).

    [10] J Chen, D Li. Regulation of the Changjiang Estuary: Past, Present and Future. Netherlands, Berlin,. Germany:, Springer, 185-197(2002).

    [11] Y Chen J, X Yun C, H Xu. The Model of Development of the Changjiang Estuary During the Last 2000 Years, 655-666(1982).

    [12] L Chen, Y Ren C, B Zhang et al. Spatiotemporal dynamics of coastal wetlands and reclamation in the Yangtze Estuary during the past 50 years (1960s-2015). Chinese Geographical Science, 28, 386-399(2018).

    [13] Y Chen, W Dong J, M Xiao X et al. Land claim and loss of tidal flats in the Yangtze Estuary. Scientific Reports, 6, 24018(2016).

    [14] Y Chen, M Wang H, J Shi Y et al. Characteristics and trends of morphological evolution of the Yangtze subaqueous delta during 1958-2015. Advances in Water Science, 29, 314-321(2018).

    [15] X Chu Z. The dramatic changes and anthropogenic causes of erosion and deposition in the lower Yellow (Huanghe) River since 1952. Geomorphology, 216, 171-179(2014).

    [16] G Cooper J A. The role of extreme floods in estuary-coastal behaviour: Contrasts between river- and tide-dominated microtidal estuaries. Sedimentary Geology, 150, 123-137(2002).

    [17] J Dai Z, S Fagherazzi, F Mei X et al. Linking the infilling of the North Branch in the Changjiang (Yangtze) estuary to anthropogenic activities from 1958 to 2013. Marine Geology, 379, 1-12(2016).

    [18] J Dai Z, T Liu J, G Fu et al. A thirteen-year record of bathymetric changes in the North Passage, Changjiang (Yangtze) estuary. Geomorphology, 187, 101-107(2013).

    [19] J Dai Z, T Liu J, W Wei. Morphological evolution of the South Passage in the Changjiang (Yangtze River) estuary, China. Quaternary International, 380, 314-326(2015).

    [20] J Dai Z, T Liu J, W Wei et al. Detection of the Three Gorges Dam influence on the Changjiang (Yangtze River) submerged delta. Scientific Reports, 4, 6600(2014).

    [21] J Dai Z, T Liu J, L Xie H et al. Sedimentation in the outer Hangzhou Bay, China: The influence of Changjiang sediment load. Journal of Coastal Research, 30, 1218-1225(2014).

    [22] B Du J, K Park, M Dellapenna T et al. Dramatic hydrodynamic and sedimentary responses in Galveston Bay and adjacent inner shelf to Hurricane Harvey. Science of the Total Environment, 653, 554-564(2019).

    [23] L Du J, L Yang S, H Feng. Recent human impacts on the morphological evolution of the Yangtze River delta foreland: A review and new perspectives. Estuarine, Coastal and Shelf Science, 181, 160-169(2016).

    [24] X Duan W, L Guo S, J Wang et al. Impact of cascaded reservoirs group on flow regime in the middle and lower reaches of the Yangtze River. Water, 8, 1-21(2016).

    [25] W Emmett W, G Wolman M. Effective discharge and gravel-bed rivers. Earth Surface Processes Landforms, 26, 1369-1380(2001).

    [26] Expert Group of Sediment Problem of the Office of the Three Gorges Project Construction Committee of the State Council(EGSP/OTGPCC), Expert Group of Sediment Problem of the Three Gorges Project of the China Changjiang Three Gorges Project Development Corporation, 2002. Research on the sediment problem of the Changjiang Three Gorges Project (1996-2000): The synthetic analysis of the 1995s’ sediment research of the Changjiang Three Gorges Project. Beijing: Intellectual Property Publishing House Co., Ltd., 8:5-100. (in Chinese)

    [27] G Fu. Recent changes of runoff, sediment discharge and suspended sediment particle size in the Yangtze estuary. Port & Waterway Engineering, 105-110(2018).

    [28] B Gomez, E Coleman S, K Sy V W et al. Channel change, bankfull and effective discharges on a vertically accreting, meandering, gravel-bed river. Earth Surface Processes and Landforms, 32, 770-785(2007).

    [29] C Guo L, M van der Wegen, D Roelvink et al. Exploration of the impact of seasonal river discharge variations on long-term estuarine morphodynamic behavior. Coastal Engineering, 95, 105-116(2015).

    [30] F He Y, Q Chen H, Y Chen J. Morphological evolution of mouth bars on the Yangtze estuarine waterways in the last 100 years. Journal of Geographical Sciences, 23, 219-230(2013).

    [31] S Hergarten, J Neugebauer H. Homogenization of Manning’s formula for modeling surface runoff. Geophysical Research Letters, 24, 877-880(1997).

    [32] Z Hu X, F Yang, X Song L et al. An unstructured-grid based morphodynamic model for sandbar simulation in the Modaomen Estuary, China. Water, 10, 611(2018).

    [33] L Huang S. Effects of using different sediment transport formulae and methods of computing Manning’s roughness coefficient on numerical modeling of sediment transport. Journal of Hydraulic Research, 45, 347-356(2007).

    [34] J Jiang C, F Li J, E de Swart H. Effects of navigational works on morphological changes in the bar area of the Yangtze Estuary. Geomorphology, 139, 205-219(2012).

    [35] P Lamb M, A Nittrouer J, D Mohrig et al. Backwater and river plume controls on scour upstream of river mouths: Implications for fluvio-deltaic morphodynamics. Journal of Geophysical Research - Earth Surface, 117, F01002(2012).

    [36] X Li L, Y Pan, L Li. Fractal characteristics and prediction of backsilting quantity in Yangtze Estuary Deepwater Channel. China Ocean Engineering, 32, 341-346(2018).

    [37] T Li M, Y Chen Z, W Yin D et al. Morphodynamic characteristics of the dextral diversion of the Yangtze River mouth, China: Tidal and the Coriolis Force controls. Earth Surface Processes and Landforms, 36, 641-650(2011).

    [38] P Li. Variations in Estuarine and Coastal Suspended Sediment Concentration and Delta Accretion/Erosion in Response to Decline in Sediment Supply From the Yangtze River, PhD Thesis. State Key Laboratory of Estuarine and Coastal Research, East China Normal University, Shanghai, China(2012).

    [39] X Li, P Liu J, B Tian. Evolution of the Jiuduansha wetland and the impact of navigation works in the Yangtze Estuary, China. Geomorphology, 253, 328-339(2016).

    [40] M Li Y, A Zhang G, W You B et al. Recent sediment characteristics and their impact factors in the Yangtze Estuary riverbed. Acta Geographica Sinica, 74, 178-190(2019).

    [41] K Lin C. Quantity and transport of sediment at the Yangtze River Estuary. Scientia Sinica Series A - Mathematical Physical Astronomical & Technical Sciences, 31, 1495-1507(1988).

    [42] H Liu, Q He, W Gert J et al. Sediment exchange and transport processes in the Yangtze River Estuary: Concurrent discussion on the effects of sediment sink in the muddy area. Acta Geographica Sinica, 66, 291-304(2011).

    [43] J Liu, F Cheng H, L Han et al. Interannual variations on siltation of the 12.5 m deepwater navigation channel in Yangtze Estuary. Advances in Water Sciences, 30, 65-75(2019).

    [44] L Luan H, X Ding P, B Wang Z et al. Decadal morphological evolution of the Yangtze Estuary in response to river input changes and estuarine engineering projects. Geomorphology, 265, 12-23(2016).

    [45] L Luan H, X Ding P, B Wang Z et al. Process-based morphodynamic modeling of the Yangtze Estuary at a decadal timescale: Controls on estuarine evolution and future trends. Geomorphology, 290, 347-364(2017).

    [46] X Luo X, L Yang S, S Wang R et al. New evidence of Yangtze delta recession after closing of the Three Gorges Dam. Scientific Reports, 7, 41735(2017).

    [47] F Mei X, J Dai Z, W Wei et al. Secular bathymetric variations of the North Channel in the Changjiang (Yangtze) Estuary, China, 1880-2013: Causes and effects. Geomorphology, 303, 30-40(2018).

    [48] Y Mo W, X Wei, G Qiu L. A long-term numerical model of morphodynamic evolution and its application to the Modaomen Estuary. China Ocean Engineering, 26, 123-138(2012).

    [49] A Nittrouer J, J Shaw, P Lamb M et al. Spatial and temporal trends for water-flow velocity and bed-material sediment transport in the lower Mississippi River. Geological Society of America Bulletin, 124, 400-414(2012).

    [50] F Su J, D Fan D. Internal facies architecture and evolution history of Changxing mouth-bar complex in the Changjiang (Yangtze) Delta, China. Journal of Ocean University of China, 17, 1281-1289(2018).

    [51] C Tan, S Huang B, F Liu et al. Transformation of the three largest Chinese river deltas in response to the reduction of sediment discharges. Journal of Coastal Research, 32, 1402-1416(2016).

    [52] M Tan G, W Fang H, S Dey et al. Rui-Jin Zhang’s research on sediment transport. Journal of Hydraulic Engineering, 144, 02518002(2018).

    [53] Z Teng L, Q Cheng H, Y Qiao Y. Analysis of flow regime in the Turbidity Maximum Zone of Yangtze Estuary based on texture features of Tiangong-2 remote sensing images. In: Gu Y, Gao M, Zhao G (eds). Proceedings of the Tiangong-2 Rem(2019).

    [54] H Wang Y, P Dong, T Oguchi et al. Long-term (1842-2006) morphological change and equilibrium state of the Changjiang (Yangtze) Estuary, China. Continental Shelf Research, 56, 71-81(2013).

    [55] H Wang Y, V Ridd P, L Wu H et al. Long-term morphodynamic evolution and the equilibrium mechanism of a flood channel in the Yangtze Estuary (China). Geomorphology, 99, 130-138(2008).

    [56] W Wei, J Dai Z, F Mei X et al. Shoal morphodynamics of the Changjiang (Yangtze) estuary: Influences from river damming, estuarine hydraulic engineering and reclamation projects. Marine Geology, 386, 32-43(2017).

    [57] W Wei, F Mei X, J Dai Z et al. Recent morphodynamic evolution of the largest uninhibited island in the Yangtze (Changjiang) estuary during 1998-2014: Influence of the anthropogenic interference. Continental Shelf Research, 124, 83-94(2016).

    [58] L Wu H, T Shen H, H Wang Y. Evolution of mouth bars in the Changjiang Estuary, China: A GIS supporting study, Paper Presented at International Conference on Estuaries and Coasts,. Hangzhou, China, 205-213(2003).

    [59] Q Xia J, J Li X, L Zhang X et al. Recent variation in reach-scale bankfull discharge in the Lower Yellow River. Earth Surface Processes and Landforms, 39, 723-734(2014).

    [60] J Xie, X Yan Y. Promoting siltation effects and impacts of Hengsha East Shoal on the Yangtze River estuary. Journal of Hydrodynamics, 23, 649-659(2011).

    [61] F Yang H, L Yang S, Y Meng et al. Recent coarsening of sediments on the southern Yangtze subaqueous delta front: A response to river damming. Continental Shelf Research, 155, 45-51(2018).

    [62] L Yang S, D Milliman J, P Li et al. 50,000 dams later: Erosion of the Yangtze River and its delta. Global and Planetary Change, 75, 14-20(2011).

    [63] L Yang S, D Milliman J, H Xu K et al. Downstream sedimentary and geomorphic impacts of the Three Gorges Dam on the Yangtze River. Earth-Science Reviews, 138, 469-486(2014).

    [64] L Yang S, H Xu K, D Milliman J et al. Decline of Yangtze River water and sediment discharge: Impact from natural and anthropogenic changes. Scientific Reports, 5, 12581(2015).

    [65] L Yang S, J Zhang, J Xu X. Influence of the Three Gorges Dam on downstream delivery of sediment and its environmental implications, Yangtze River. Geophysical Research Letters, 34, L10401(2007).

    [66] P Yang Y, Y Deng J, J Zhang M et al. The synchronicity and difference in the change of suspended sediment concentration in the Yangtze River Estuary. Journal of Geographical Sciences, 25, 399-416(2015).

    [67] P Yang Y, T Li Y, H Sun Z et al. Suspended sediment load in the turbidity maximum zone at the Yangtze River Estuary: The trends and causes. Journal of Geographical Sciences, 24, 129-142(2014).

    [68] X Yun C. Recent Developments of the Changjiang Estuary., 31-47, 108-114(2004).

    [69] J Zeng. Data mining-based characteristics of flow and sediment transport in Qiantang estuary. Hangzhou, China: College of Civil Engineering and Architecture, Zhejiang University(2010).

    [70] M Zhang, I Townend, X Zhou Y et al. Seasonal variation of river and tide energy in the Yangtze Estuary, China. Earth Surface Processes and Landforms, 41, 98-116(2016).

    [71] W Zhang M, Q Dong, W Cui T et al. Suspended sediment monitoring and assessment for Yellow River estuary from Landsat TM and ETM plus imagery. Remote Sensing of Environment, 146, 136-147(2014).

    [72] F Zhang Y, K Zhang Z, H Ren et al. The sedimentation rates of tidal flat and environmental significance at Qidong foreland of the Yangtze Estuary. Transactions of Oceanology and Limnology, 36-43(2018).

    [73] J Zhao, C Guo L, Q He et al. An analysis on half century morphological changes in the Changjiang Estuary: Spatial variability under natural processes and human intervention. Journal of Marine Systems, 181, 25-36(2018).

    [74] W Zheng S, Q Cheng H, Y Shi S et al. Impact of anthropogenic drivers on subaqueous topographical change in the Datong to Xuliujing reach of the Yangtze River. Science China - Earth Sciences, 61, 940-950(2018).

    [75] Y Zhu B, T Li Y, Y Yue et al. Aggravation of north channels’ shrinkage and south channels’ development in the Yangtze Estuary under dam-induced runoff discharge flattening. Estuarine Coastal and Shelf Science, 187, 178-192(2017).

    [76] L Zhu, Q He, J Shen et al. The influence of human activities on morphodynamics and alteration of sediment source and sink in the Changjiang Estuary. Geomorphology, 273, 52-62(2016).

    Boyuan ZHU, Yitian LI, Yao YUE, Yunping YANG, Enhang LIANG, Chuncai ZHANG, Alistair G. L. BORTHWICK. Alternate erosion and deposition in the Yangtze Estuary and the future change[J]. Journal of Geographical Sciences, 2020, 30(1): 145
    Download Citation