
Chuang Chen, Ya Wang, Wenwu Jia. A Subgraph Learning Method for Graph Matching[J]. Laser & Optoelectronics Progress, 2020, 57(6): 061003
- Laser & Optoelectronics Progress
- Vol. 57, Issue 6, 061003 (2020)
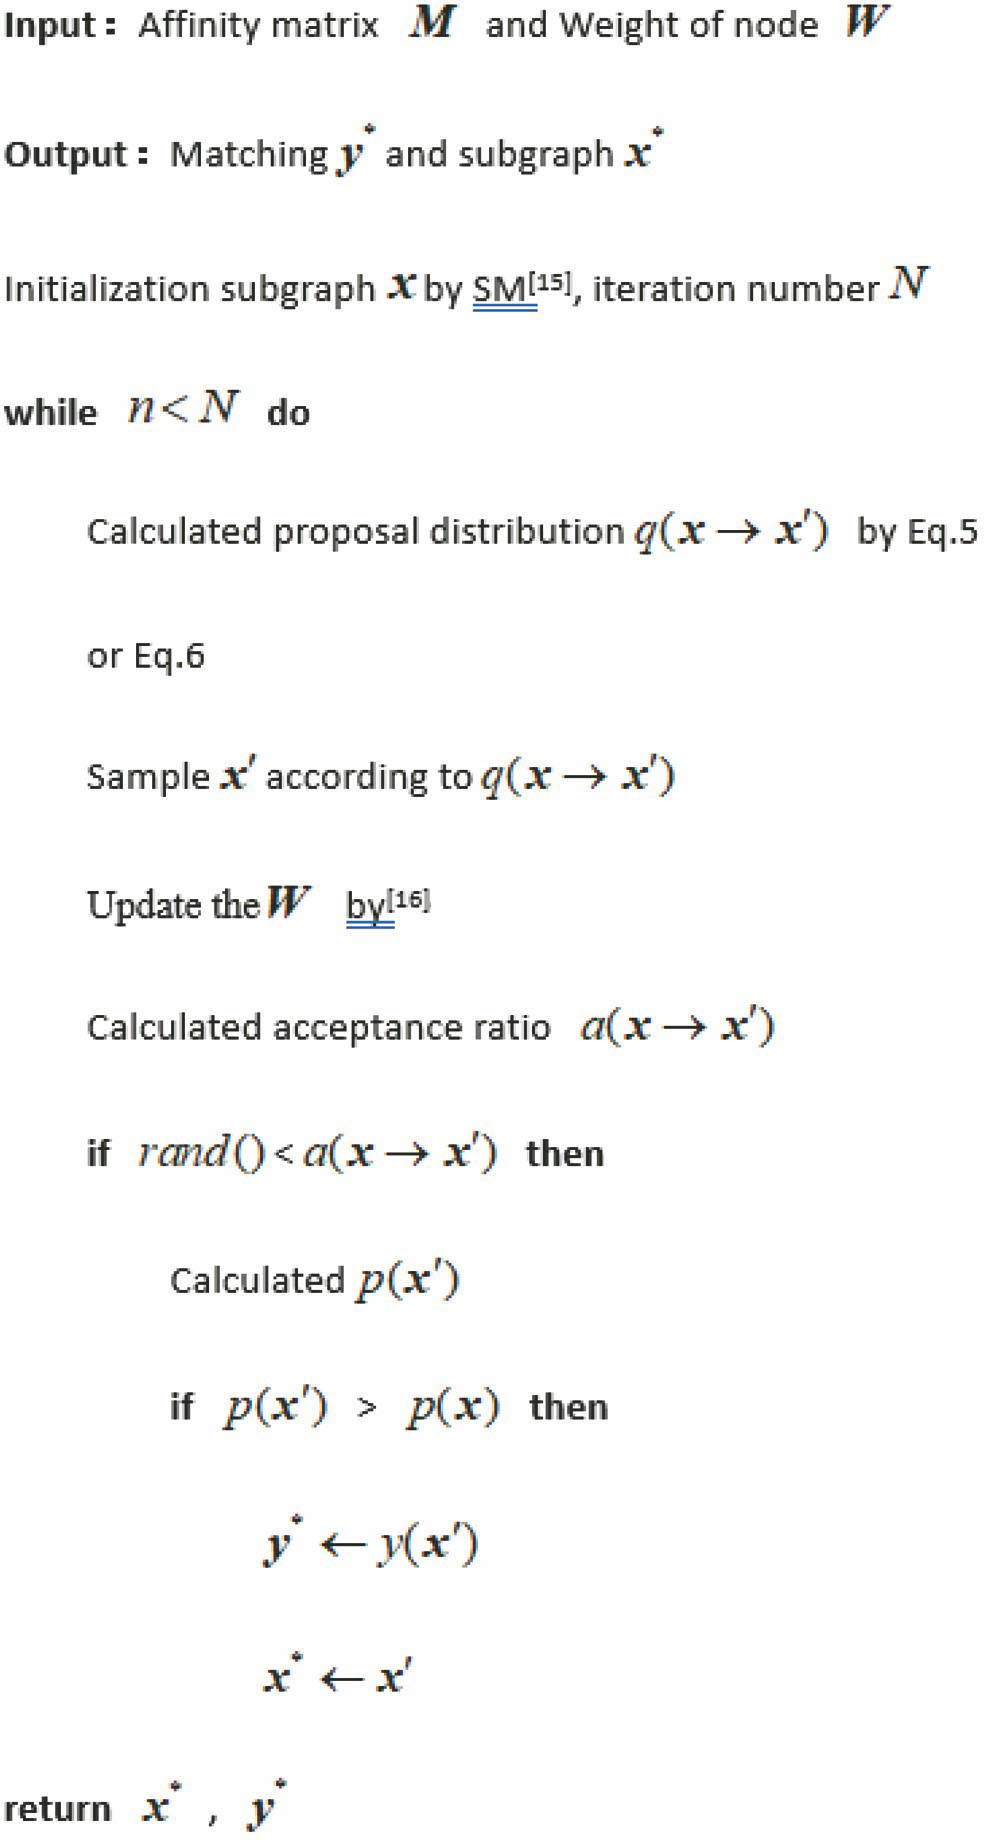
Fig. 1. Sub-graph matching algorithm based on MCMC
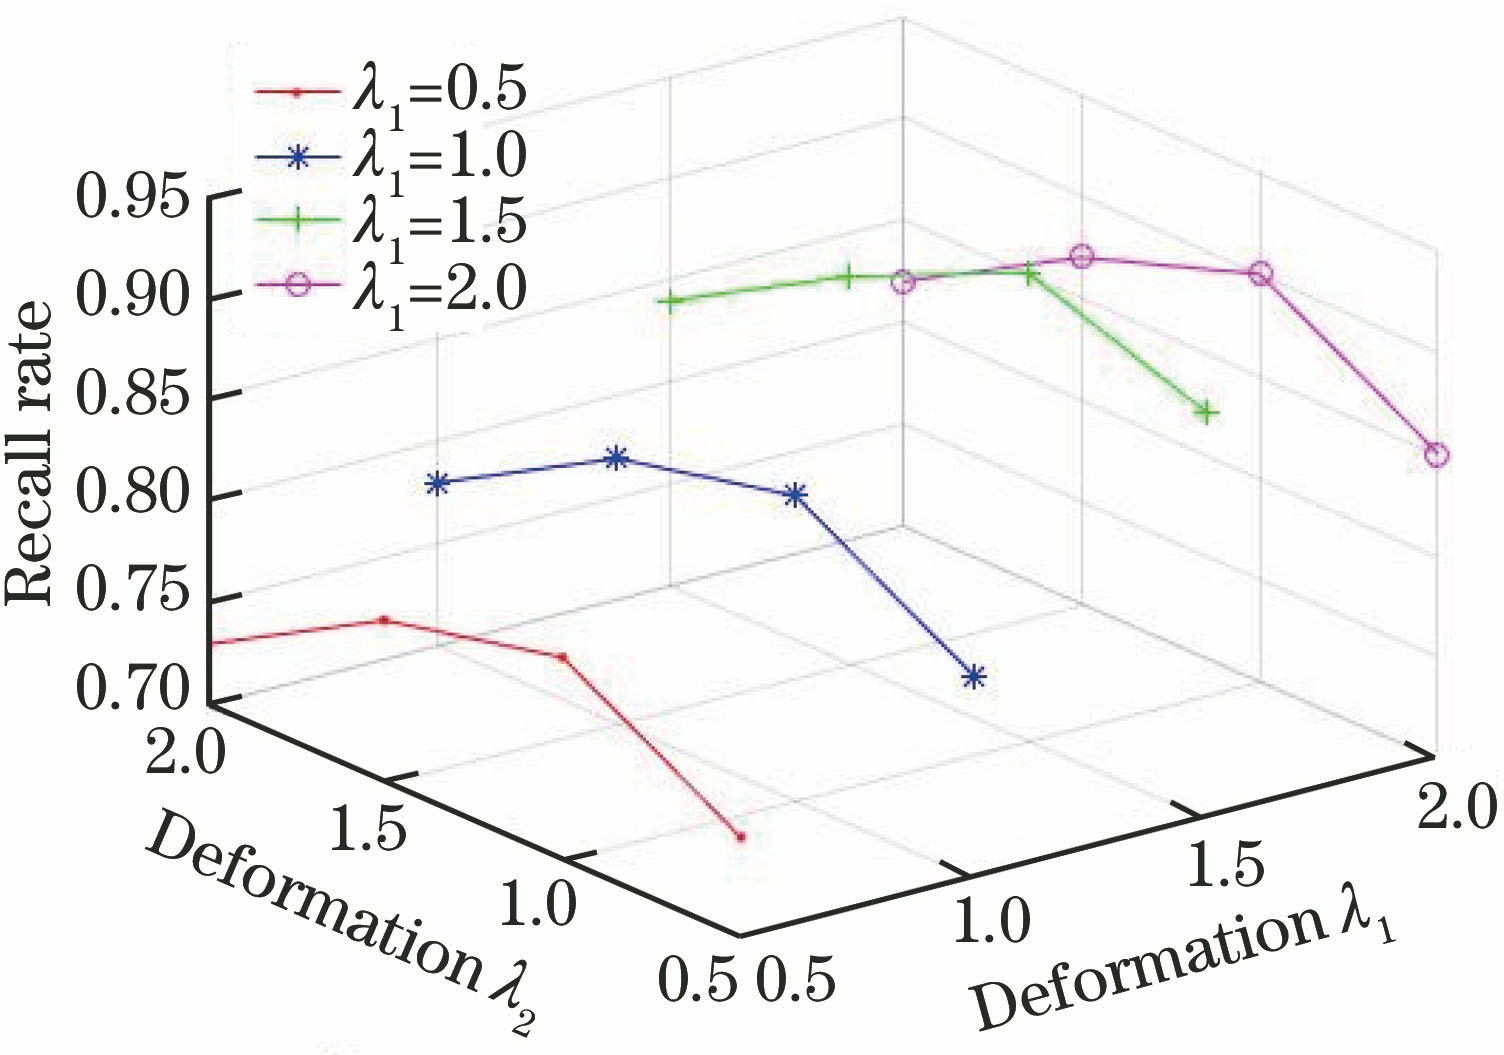
Fig. 2. Recall rate curves
Fig. 3. Precision curves
Fig. 4. Recall rate and precision in the outlier experiments. (a) Effect of discrete values on recall rate; (b) effect of discrete values on precision
Fig. 5. Recall rate and precision in the deformation noise experiments. (a) Effect of deformation noise on recall rate; (b) effect of deformation noise on precision
Fig. 6. Recall rate and precision in the experiments with different edge densities. (a) Effect of edge density on recall rate; (b) effect of edge density on precision
Fig. 7. Samples of graph matching for motorbike on Caltech+MSRC. (a) SGM-based matching sample (correct matching rate is 12/54); (b) RRWM-based matching sample (correct matching rate is 11/67); (c) IPFP-based matching sample (correct matching rate is 7/67); (d) SM-based matching sample (correct matching rate is 9/67)
Fig. 8. Samples of graph matching for cap on Caltech+MSRC. (a) SGM-based matching sample (correct matching rate is 4/7); (b) RRWM-based matching sample (correct matching rate is 4/9); (c) IPFP-based matching sample (correct matching rate is 2/9); (d) SM-based matching sample (correct matching rate is 2/9)
Fig. 9. Samples of graph matching for car on Caltech+MSRC. (a) SGM-based matching sample (correct matching rate is 16/30); (b) RRWM-based matching sample (correct matching rate is 12/36); (c) IPFP-based matching sample (correct matching rate is 4/36); (d) SM-based matching sample (correct matching rate is 4/36)
Fig. 10. Results of view-based 3D model retrieval experiments in MV-RED data set. (a) P-R curves; (b) performance
|
Table 1. Recall rate and precision of different methods on Caltech+MSRC

Set citation alerts for the article
Please enter your email address
© Copyright 2018-2021 | Chinese Laser Press. All Rights Reserved 沪ICP备15018463号-20