
Shudong Yu, Yong Tang, Zongtao Li, Kaihang Chen, Xinrui Ding, Binhai Yu. Enhanced optical and thermal performance of white light-emitting diodes with horizontally layered quantum dots phosphor nanocomposites[J]. Photonics Research, 2018, 6(2): 90
- Photonics Research
- Vol. 6, Issue 2, 90 (2018)
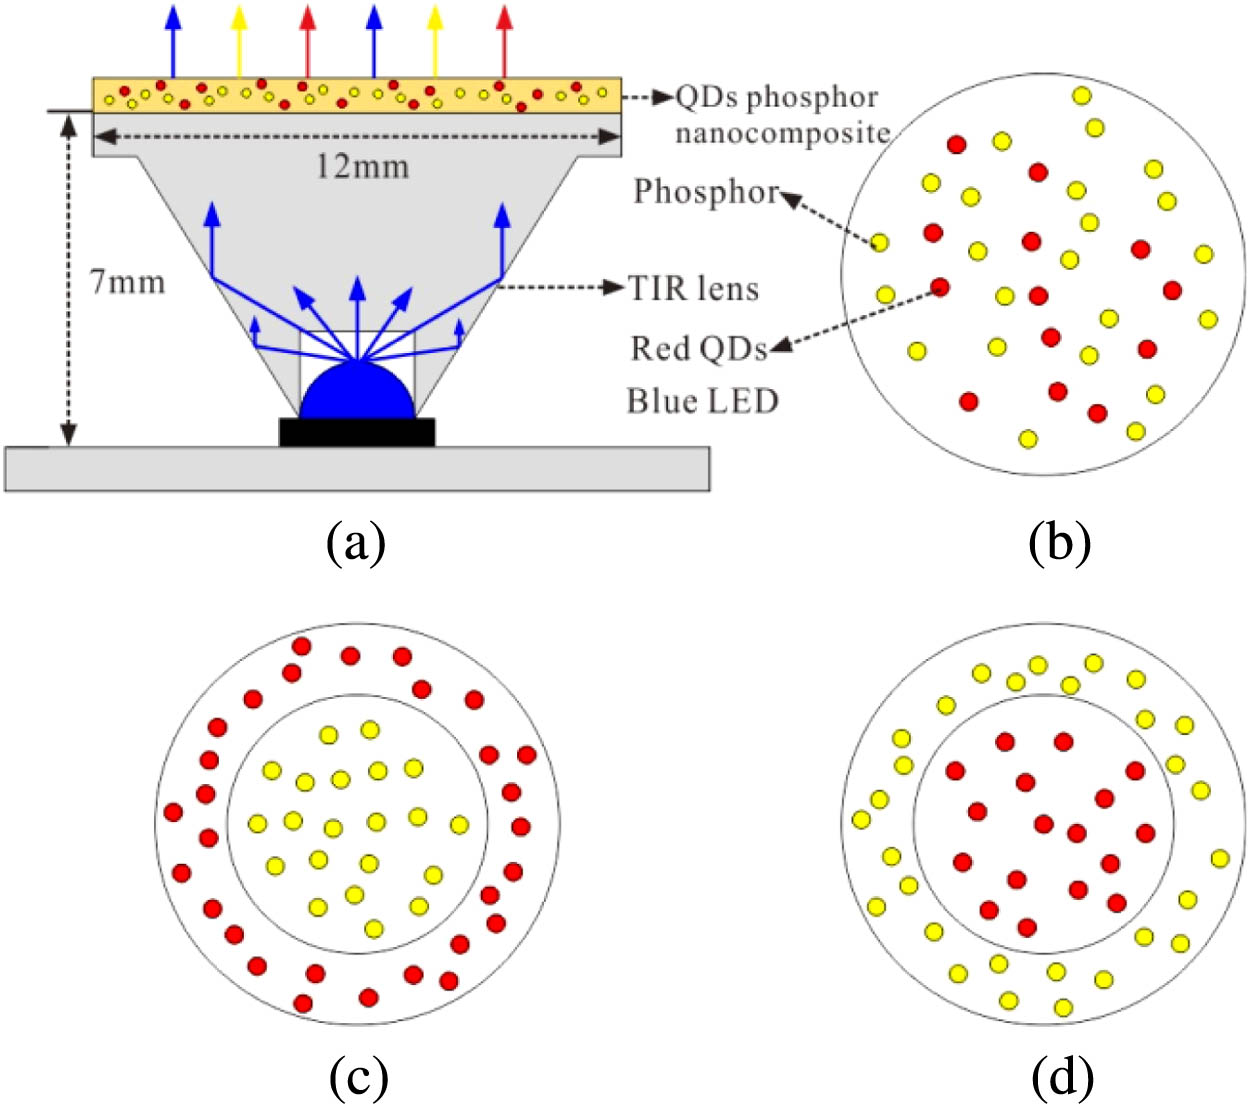
Fig. 1. (a) Diagram of WLED device with QDs phosphor nanocomposite. (b) Mixed type. (c) QDs-outside type. (d) QDs-inside type.
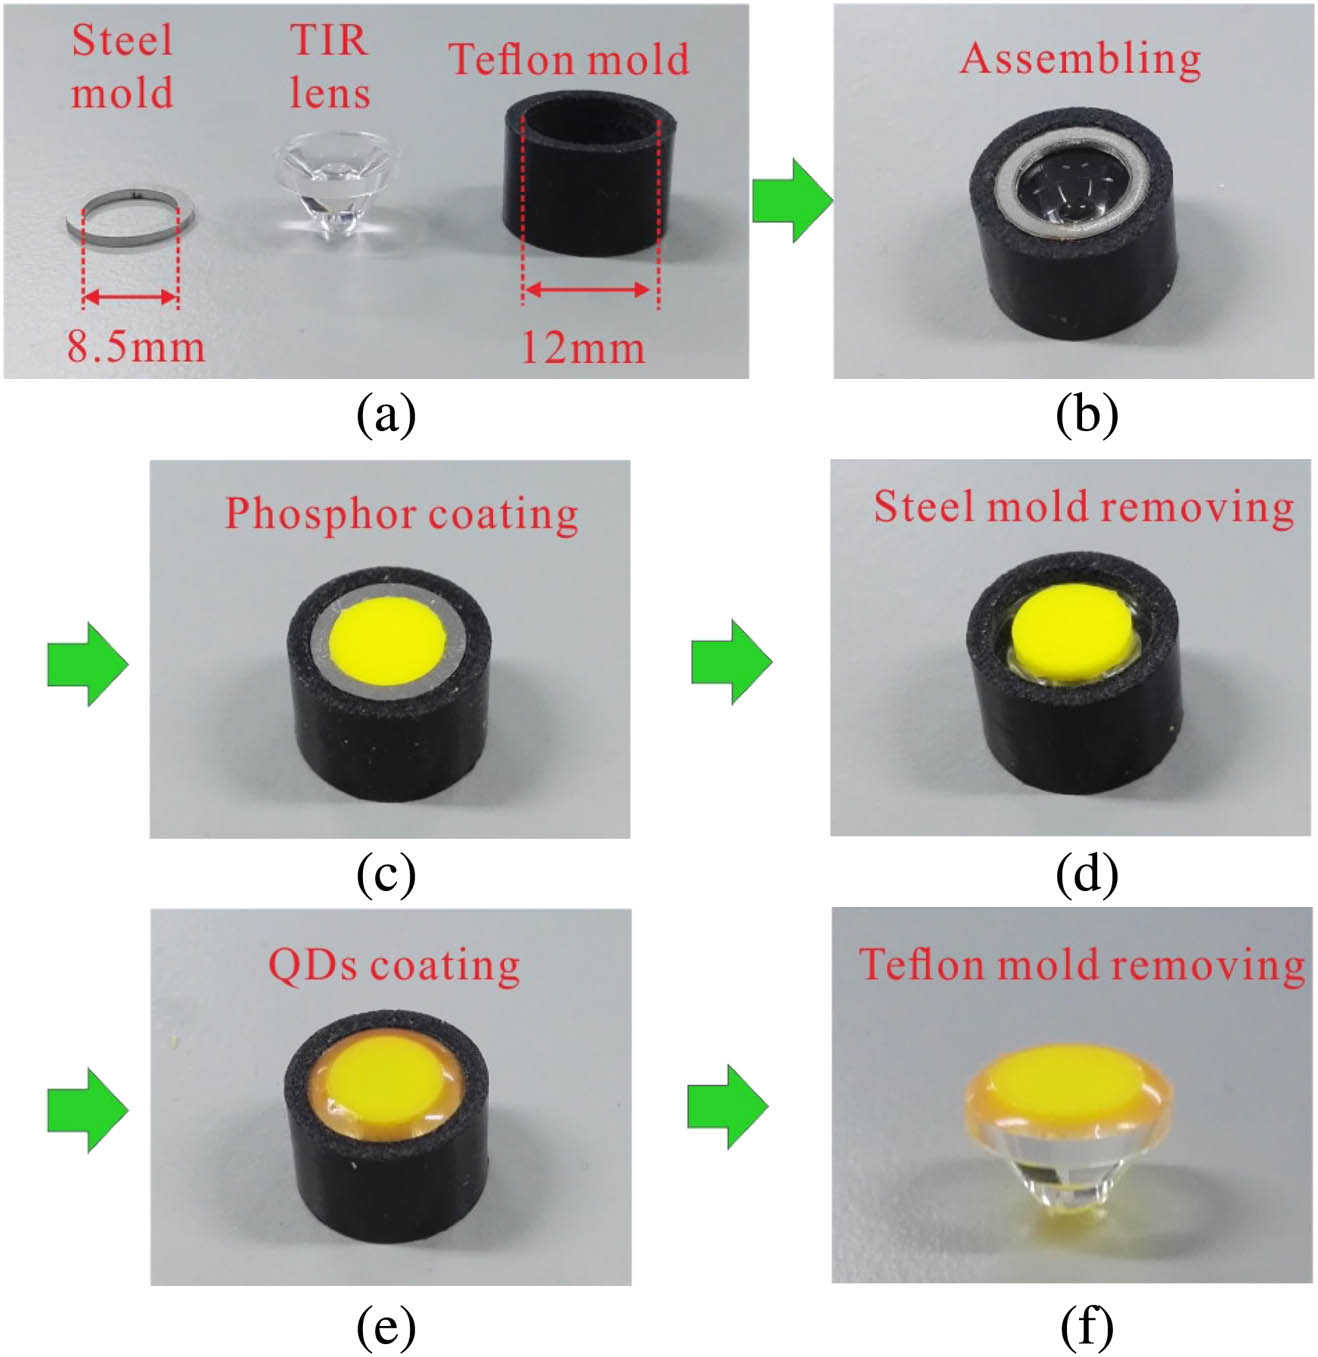
Fig. 2. Fabrication process of horizontally layered quantum dots phosphor nanocomposite (QDs-outside type): (a) molds and TIR lens, (b) parts assembling, (c) phosphor coating, (d) steel mold removing, (e) QDs coating, and (f) Teflon mold removing.
Fig. 3. (a) LED device without QDs-phosphor nanocomposite. (b)–(d) LED devices with different QDs-phosphor nanocomposites: mixed type; QDs-outside type; QDs-inside type.
Fig. 4. (a) High-resolution TEM images of the CdSe/ZnS core-shell QDs. Inset: photograph of QDs solution under UV light exposure. Scale bars: 30 nm, 5 nm. (b) Excitation and PL spectra of YAG phosphor and QDs.
Fig. 5. Optical power, LE and LER of the three WLED devices at varying current from 100 mA to 700 mA.
Fig. 6. (a) Normalized emission spectra of three WLED devices (mixed type, QDs-outside type, and QDs-inside type) at 400 mA. Inset shows the corresponding optical characteristics. (b) Their separated emission power (blue emission, YAG emission, and QDs emission).
Fig. 7. CIE color coordinates in the 1931 chromaticity diagram of mixed type, QDs-outside type, and QDs-inside type WLEDs and corresponding photo images at an operating current of 400 mA.
Fig. 8. Normalized emission spectra of yellow LED and yellow LED with red QDs. Inset: diagram of measuring setup.
Fig. 9. Normalized light intensity distribution of LED devices without/with lens. Inset: light energy proportion of central region and peripheral region.
Fig. 10. (a) Photograph of the three lighting WLED devices. (b) Temperature fields of three WLED devices measured by infrared video camera under driving current of 400 mA.
|
Table 1. Optical and Thermal Characteristics of the Three WLED Devices at 400 mA

Set citation alerts for the article
Please enter your email address
© Copyright 2018-2021 | Chinese Laser Press. All Rights Reserved 沪ICP备15018463号-20