• Photonics Research
  • Vol. 6, Issue 3, 204 (2018)
Hong-Jin Hu1, Fan-Wei Zhang1, Guo-Zhou Li1, Jun-Yi Chen1, Qiang Li1, and Li-Jun Wu1、2、*
Author Affiliations
  • 1Guangdong Provincial Key Laboratory of Nanophotonic Functional Materials and Devices, School of Information and Optoelectronic Science and Engineering, South China Normal University, Guangzhou 510006, China
  • 2State Key Laboratory of Optoelectric Materials and Technologies, Sun Yat-sen University, Guangzhou 510275, China
  • show less
    DOI: 10.1364/PRJ.6.000204 Cite this Article Set citation alerts
    Hong-Jin Hu, Fan-Wei Zhang, Guo-Zhou Li, Jun-Yi Chen, Qiang Li, Li-Jun Wu. Fano resonances with a high figure of merit in silver oligomer systems[J]. Photonics Research, 2018, 6(3): 204 Copy Citation Text show less
    (a) Schematic of the proposed quadrumer system. Geometrical parameters are fixed as (unless otherwise specified) D=30 nm, S=30 nm, thickness T=16 nm, L=100 nm, and W=40 nm. (b) The corresponding numerically obtained scattering spectrum of the system (blue open circles) can be decomposed into two bright modes (gray and purple dashed lines) and two asymmetric Fano modes (cyan and red dashed lines). The green solid line is calculated by the analytical equation (A1) from the Appendix A. (c) Surface charge (top panel) and electric field (bottom panel) distributions at different wavelengths. The color of the frame and the mark spots in (b) are consistent.
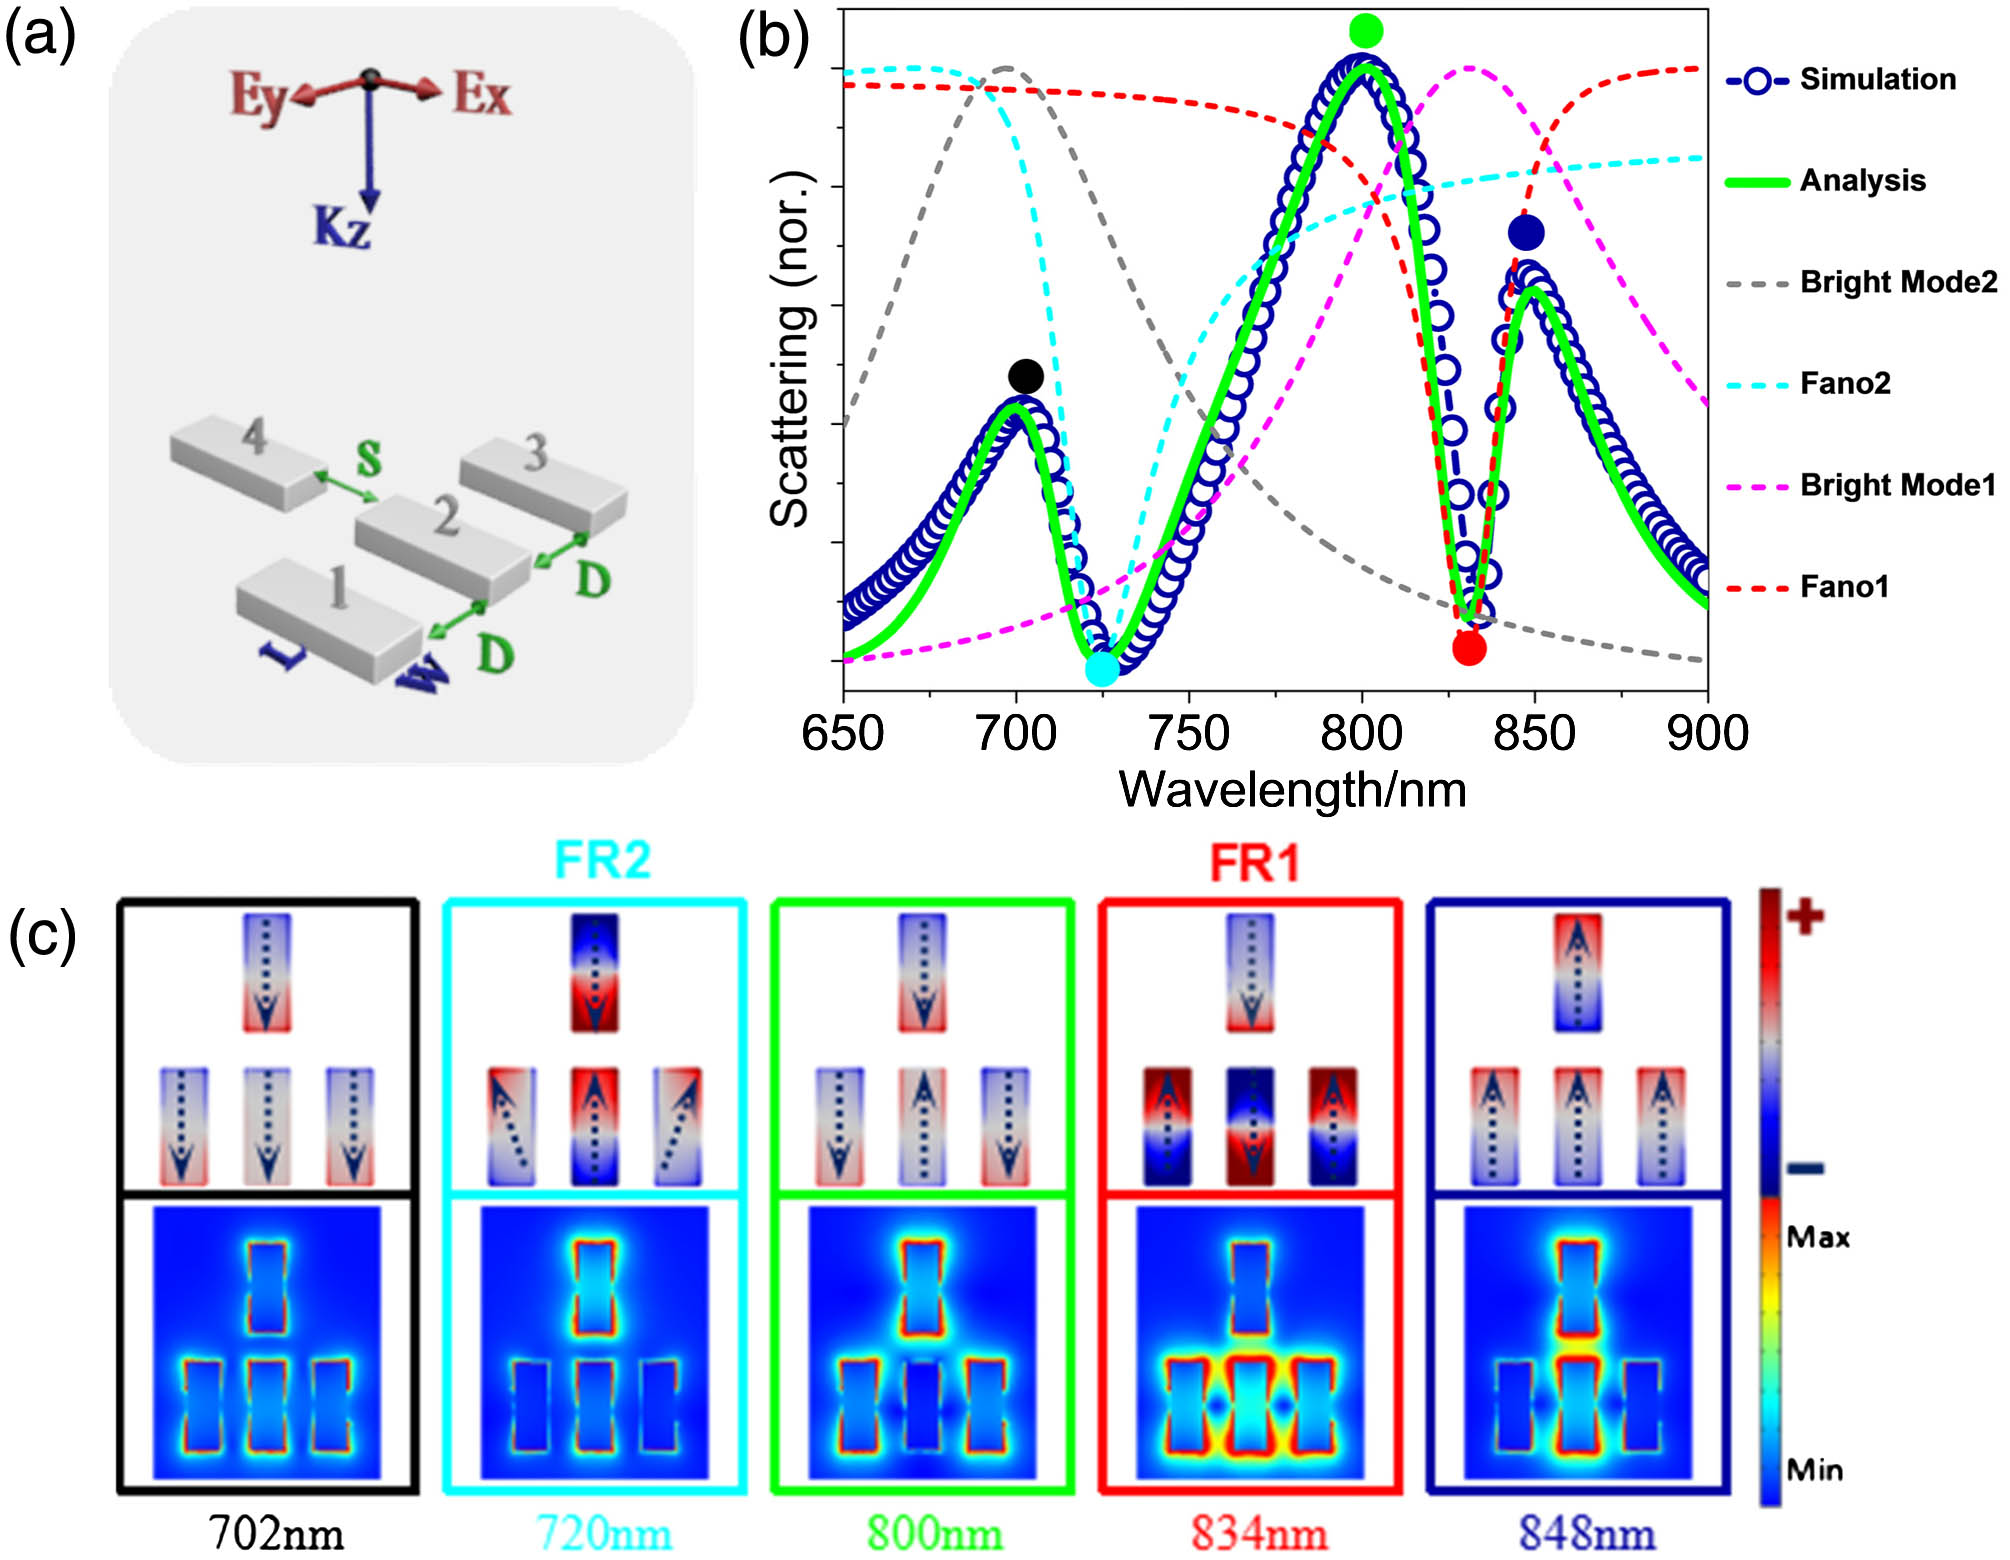
    Fig. 1. (a) Schematic of the proposed quadrumer system. Geometrical parameters are fixed as (unless otherwise specified) D=30  nm, S=30  nm, thickness T=16  nm, L=100  nm, and W=40  nm. (b) The corresponding numerically obtained scattering spectrum of the system (blue open circles) can be decomposed into two bright modes (gray and purple dashed lines) and two asymmetric Fano modes (cyan and red dashed lines). The green solid line is calculated by the analytical equation (A1) from the Appendix A. (c) Surface charge (top panel) and electric field (bottom panel) distributions at different wavelengths. The color of the frame and the mark spots in (b) are consistent.
    Simulated scattering spectra for the Q1 system (blue open circles), the bottom trimer (Bar1+Bar2+Bar3, gray solid line), and the middle dimer (Bar2+Bar4, cyan solid line). The decomposed two bright modes are also shown (gray and purple dashed lines) together for comparison.
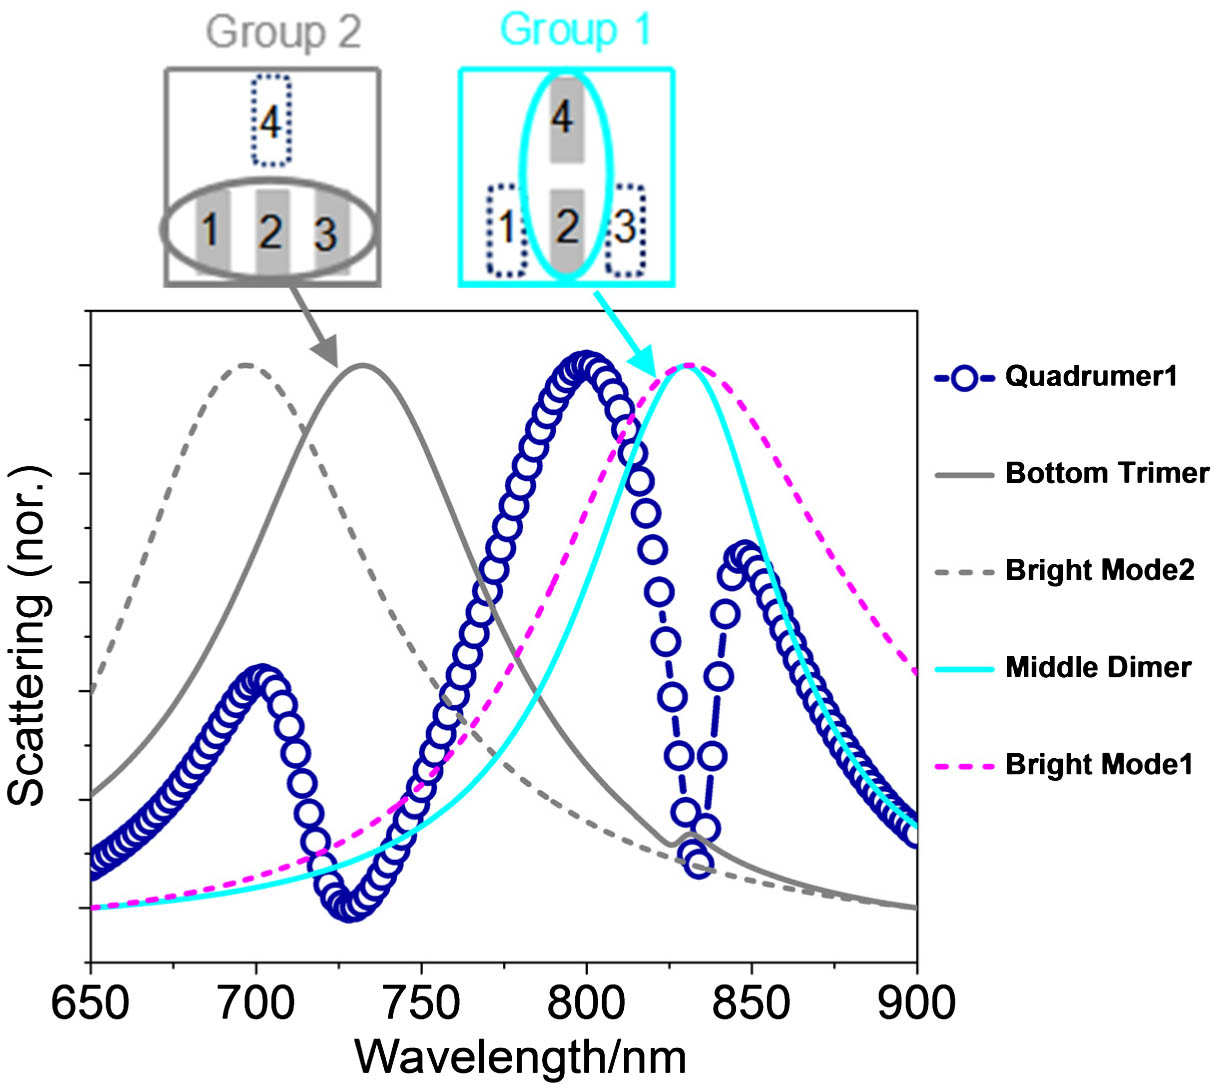
    Fig. 2. Simulated scattering spectra for the Q1 system (blue open circles), the bottom trimer (Bar1+Bar2+Bar3, gray solid line), and the middle dimer (Bar2+Bar4, cyan solid line). The decomposed two bright modes are also shown (gray and purple dashed lines) together for comparison.
    (a) Evolution of the scattering spectra of Q1 at normal incidence with different polarization angles, where the 0° (90°) corresponds to the positive y (x) direction. (b) The charge distribution of Q1 at FR1 (834 nm) for polarizations at 0°, 10°, 50°, and 90°, respectively.
    Fig. 3. (a) Evolution of the scattering spectra of Q1 at normal incidence with different polarization angles, where the 0° (90°) corresponds to the positive y(x) direction. (b) The charge distribution of Q1 at FR1 (834 nm) for polarizations at 0°, 10°, 50°, and 90°, respectively.
    Scattering spectra of Q1 with (a) D varied from 30 nm to 60 nm, (b) S varied from 30 nm to 60 nm, (c) M varied from 65 nm to 130 nm, and (d) T varied from 16 nm to 40 nm. For M=0, please refer to the following Fig. 9(b).
    Fig. 4. Scattering spectra of Q1 with (a) D varied from 30 nm to 60 nm, (b) S varied from 30 nm to 60 nm, (c) M varied from 65 nm to 130 nm, and (d) T varied from 16 nm to 40 nm. For M=0, please refer to the following Fig. 9(b).
    Scattering spectra of the (a) Q1, (b) Q2, and (c) pentamer systems as a function of the refractive index of the surrounding medium.
    Fig. 5. Scattering spectra of the (a) Q1, (b) Q2, and (c) pentamer systems as a function of the refractive index of the surrounding medium.
    FoMs of FR1 for the Q1, Q2, and pentamer systems, which are calculated based on the scattering spectra shown in Figs. 5(a)–5(c). Please note that not all the scattering spectra are shown there. The black solid line represents the theoretical value obtained by the Eq. (1).
    Fig. 6. FoMs of FR1 for the Q1, Q2, and pentamer systems, which are calculated based on the scattering spectra shown in Figs. 5(a)5(c). Please note that not all the scattering spectra are shown there. The black solid line represents the theoretical value obtained by the Eq. (1).
    (a) Schematic of the quadrumer 2 (Q2) system. Geometrical parameters are chosen as the same as those in Fig. 1(a). (b) The corresponding numerically obtained scattering spectrum of the system (blue open circles) can be decomposed into a bright mode (gray dashed line) and an asymmetric Fano mode (cyan dashed line). The green solid line represents the analysis data calculated by the Eq. (A1) in Appendix A.
    Fig. 7. (a) Schematic of the quadrumer 2 (Q2) system. Geometrical parameters are chosen as the same as those in Fig. 1(a). (b) The corresponding numerically obtained scattering spectrum of the system (blue open circles) can be decomposed into a bright mode (gray dashed line) and an asymmetric Fano mode (cyan dashed line). The green solid line represents the analysis data calculated by the Eq. (A1) in Appendix A.
    (a) Simulated scattering spectrum of the Q2 system (blue open circles) can be decomposed into one bright mode (gray dashed line) and one asymmetric Fano mode (red dashed line). The cyan solid line plots the simulated scattering spectrum from the middle dimer, while the green solid line indicates the analyzed data. (b) Corresponding surface charge (top panel) and electric field (bottom panel) distributions at different wavelengths.
    Fig. 8. (a) Simulated scattering spectrum of the Q2 system (blue open circles) can be decomposed into one bright mode (gray dashed line) and one asymmetric Fano mode (red dashed line). The cyan solid line plots the simulated scattering spectrum from the middle dimer, while the green solid line indicates the analyzed data. (b) Corresponding surface charge (top panel) and electric field (bottom panel) distributions at different wavelengths.
    (a) Evolution of the simulated scattering spectra of the quadrumer by pushing the two central nanobars along the x direction. M defines the pushing distance away from the symmetric center along the x direction. (b) Calculated distribution of surface charges with M=0, 16, and 48 nm, respectively. The top panel framed by dashed lines corresponds to the shorter wavelength dip, while the bottom panel corresponds to the longer one. FR2 disappears when M=0 nm.
    Fig. 9. (a) Evolution of the simulated scattering spectra of the quadrumer by pushing the two central nanobars along the x direction. M defines the pushing distance away from the symmetric center along the x direction. (b) Calculated distribution of surface charges with M=0, 16, and 48 nm, respectively. The top panel framed by dashed lines corresponds to the shorter wavelength dip, while the bottom panel corresponds to the longer one. FR2 disappears when M=0  nm.
    (a) Schematic of the pentamer. The unit cells are the same as those in Q1. D1=D2=30 nm. (b) The corresponding simulated scattering spectrum can also be decomposed into two bright modes and two asymmetric Fano modes. The color and line styles are consistent with those in Fig. 1(b). (c) Calculated surface charge and electric field distributions of the pentamer at FR1 and FR2, respectively.
    Fig. 10. (a) Schematic of the pentamer. The unit cells are the same as those in Q1. D1=D2=30  nm. (b) The corresponding simulated scattering spectrum can also be decomposed into two bright modes and two asymmetric Fano modes. The color and line styles are consistent with those in Fig. 1(b). (c) Calculated surface charge and electric field distributions of the pentamer at FR1 and FR2, respectively.
    Simulated scattering spectra for the pentamer system (blue open circles), the bottom trimer (green solid line), and the top dimer combined with the bottom central nanobar (cyan solid line). The decomposed two bright modes are also shown (gray and purple dashed lines) together for comparison.
    Fig. 11. Simulated scattering spectra for the pentamer system (blue open circles), the bottom trimer (green solid line), and the top dimer combined with the bottom central nanobar (cyan solid line). The decomposed two bright modes are also shown (gray and purple dashed lines) together for comparison.
    Simulated scattering spectra for the pentamer system in which the blue (green) solid line represents D2=30 nm (20 nm). Other geometric parameters are the same as in Figs. 1 and 10.
    Fig. 12. Simulated scattering spectra for the pentamer system in which the blue (green) solid line represents D2=30  nm (20 nm). Other geometric parameters are the same as in Figs. 1 and 10.
    Hong-Jin Hu, Fan-Wei Zhang, Guo-Zhou Li, Jun-Yi Chen, Qiang Li, Li-Jun Wu. Fano resonances with a high figure of merit in silver oligomer systems[J]. Photonics Research, 2018, 6(3): 204
    Download Citation