1Guangdong Provincial Key Laboratory of Nanophotonic Functional Materials and Devices, School of Information and Optoelectronic Science and Engineering, South China Normal University, Guangzhou 510006, China
2State Key Laboratory of Optoelectric Materials and Technologies, Sun Yat-sen University, Guangzhou 510275, China
A silver quadrumer consisting of four parallel aligned rectangular nanobars, with three at the bottom and one at the top, is proposed to provide two Fano resonances. These two resonances can be adjusted either simultaneously or independently simply by tuning the geometrical parameters. Due to the formation of the two resonances in a relatively short wavelength range, one of them can be spectrally squeezed to be very narrow, which induces a very high figure of merit (). By decomposing the scattering spectrum into bright modes and dark modes, the double Fano resonances are found to be originated from grouping the unit cells into two different groups. The evolution of the scattering spectrum with the central dimer position along the polarization direction suggests that the symmetry reducing induces the second Fano resonance and improves the FoM of the first one. By introducing one more nanobar into the quadrumer system, the FoM can approach the material’s limit, although the dip is relatively shallow. The ultrahigh FoM of the Fano resonance in the proposed quadrumer can provide ultra-sensitive refractive index sensing. Furthermore, the method for providing multiple independently tunable Fano resonances can offer new solutions to designing plasmonic-related nanolasers, photocatalysis, and biochemical sensors, etc.
Plasmonic Fano resonances arising from electromagnetic interactions in metallic nanostructures have become a popular research topic in recent years because of their unique optical properties [1–3]. Intrinsically, they can be recognized as the interference between a superradiant (bright) mode that is directly excited and a subradiant (dark) mode that is indirectly excited when these two modes are overlapped spectrally and spatially [4]. Due to the sharp asymmetric line-shape and the ability to localize strong electromagnetic energy, plasmonic Fano resonances have shown diverse applications in surface-enhanced spectroscopy [5,6], biosensors [7–9], photocatalysis [10], low-threshold nanolasers, and novel on-chip photonic device designs [11], to name but a few.
As plasmonic refractive index sensors can take the advantages of the narrow linewidth of the Fano dip, this application has been mostly investigated, and continuous efforts have been devoted to searching for nanostructures owning ultra-sensitive detecting ability [12–15]. The sensitivity of the plasmonic sensors is normally evaluated by the figure of merit (FoM) [defined as ], in which “” and the “linewidth” correspond to the shift of the resonance energy as a function of the refractive index and the width of the resonance, respectively. For Fano-type resonances, the linewidth was defined as the energy difference between the Fano dip and its closest peak due to its asymmetric line-shape [4,16,17]. The FoM is ultimately limited by the ohmic loss and inherently dependent on the type of the metal materials under quasi-static approximation. Either based on Drude model or a finite element method (FEM) model using Johnson and Christy experimental data for the permittivity, FoM is larger at the near-infrared wavelength range for noble metal Ag or Au [18], which is a particularly useful window for bio-related applications because of water’s transparency. A variety of plasmonic nanostructures, such as complex heterodimers [19,20], quadrumer clusters [21], and ring/disk nanocavities [22,23], have been shown to exhibit Fano resonances in the optical frequency range. However, few metallic oligomers can approach the materials’ limit, especially at the near-infrared wavelength range [24].
Compared to a single Fano resonance, multiple Fano resonances in which the plasmon line-shape can be tuned at several spectral positions simultaneously are more powerful in some applications [25–36]. For example, multiple Fano resonances have been applied for three-dimensional rulers [37], multi-wavelength biosensing [38], and highly directional on-chip antennas [39], etc. However, most of the reported multiple Fano resonances are a direct result of the collective behavior of the total plasmonic systems [28,40,41] and cannot be tuned independently, which will limit their applications in some degree [42].
Sign up for Photonics Research TOC. Get the latest issue of Photonics Research delivered right to you!Sign up now
As there are only four nanoparticles in the system that facilitates the bottom-up assembly procedure, quadrumers are one of the very early oligomers to realize Fano resonances. When the symmetry of the quadrumer is reduced from to , the interaction between the two central and outer nanoparticles that oscillate oppositely can give rise to a Fano resonance [4]. However, the FoM of an Au quadrumer is as low as 10. It can be improved in Ag nanostructures due to the lower imaginary part of its dielectric constant. For example, an FoM of has been achieved in a relatively complicated dual-disk ring Ag nanostructure [38]. It can be increased to be 56–61 at a wavelength range from 750 nm to 850 nm in a more complicated Ag dimer nanostructure in which the gap size between two nanocubes is as small as 2 nm [24]. Nonetheless, only one Fano resonance exists in these nanostructures. Furthermore, the sample fabrication is difficult because of the complexity of the nanostructures. Easily realized oligomer systems simultaneously owning higher FoM and multiple Fano resonances are highly desirable in order to extend the applications for plasmonic sensors.
In this paper, we propose a new type of Ag quadrumer, consisting of four parallel aligned rectangular nanobars, with three at the bottom and one at the top. Due to their special layout, two Fano resonances can be generated without involving higher-order modes. As they are produced by two different groups of nanobars, the two Fano resonances can be controlled independently or simultaneously simply by adjusting the geometric parameters. The Fano dips are also very easy to be tuned to the water’s transparent near-infrared window, in which the upper limit of the material-dependent FoM is larger. More importantly, the formation of the two Fano resonances causes one of them to be squeezed spectrally and leads to a very sharp Fano dip. Therefore, an FoM as high as 45 can be achieved under a typical effective refractive index of 1.42 (corresponding to the nanobars located between the glass substrate and water) at a wavelength of 936 nm. The analyses of the evolution of the scattering responses and the charge distributions with the position shift of central nanobars show that the new generated Fano resonance is originated from the further symmetry breaking of the conventional quadrumer. If another nanobar is introduced into the quadrumer system, the FoM can approach the material’s limit in the near-infrared window under quasi-static approximation, although the Fano dip becomes shallower.
2. RESULTS AND DISCUSSION
A. Model and Calculations
Numerical calculation for the field/charge distributions at specific wavelength and scattering spectra of the system is performed utilizing a commercial FEM package (COMSOL Multiphysics 5.2a). The nanobars are supposed to be embedded in a homogeneous medium. The permittivity of Ag is taken from the experimental data obtained by Johnson and Christy (J&C) [43]. To avoid numerical artifacts in simulations, the corners of the nanobars are smoothed by a curvature of 2 nm.
Based on the physical generating mechanisms of Fano resonances, a few mathematical models, such as the mass oscillator model and quantum mechanical theory, have been applied in many systems [39,44,45]. However, these models are not sufficient to provide a complete scenario of plasmonic Fano resonances. Recently, Gallinet and Martin derived a closed-form analytical formula based on ab initio theory to reveal the roles played by the electromagnetic modes and material losses in the metallic nanostructures [46]. In their formula, the Fano resonance is built from the interference between a radiative symmetric resonance (bright) mode and a nonradiative asymmetric resonance (dark) mode that spectrally and spatially overlap [16,47]. We utilize their model to analyze the scattering spectra in our system. The description of the equations is given in the Appendix A.
In the quasi-static limit, when the nanostructures are much smaller than the wavelength, the FoM of refractive index sensing for the system approaches the materials’ limit and can be derived as [24]where and are the real and imaginary part of the metal permittivity by interpolating the J&C permittivity data. represents the refractive index of the surrounding medium. In our proposed system, the largest dimension of the nanobar is 100 nm, and its effective volume equals volume of sphere with a radius as small as 25 nm. Thus, it is small enough to ignore the size-dependent impact.
B. Analysis for the Proposed Quadrumer System
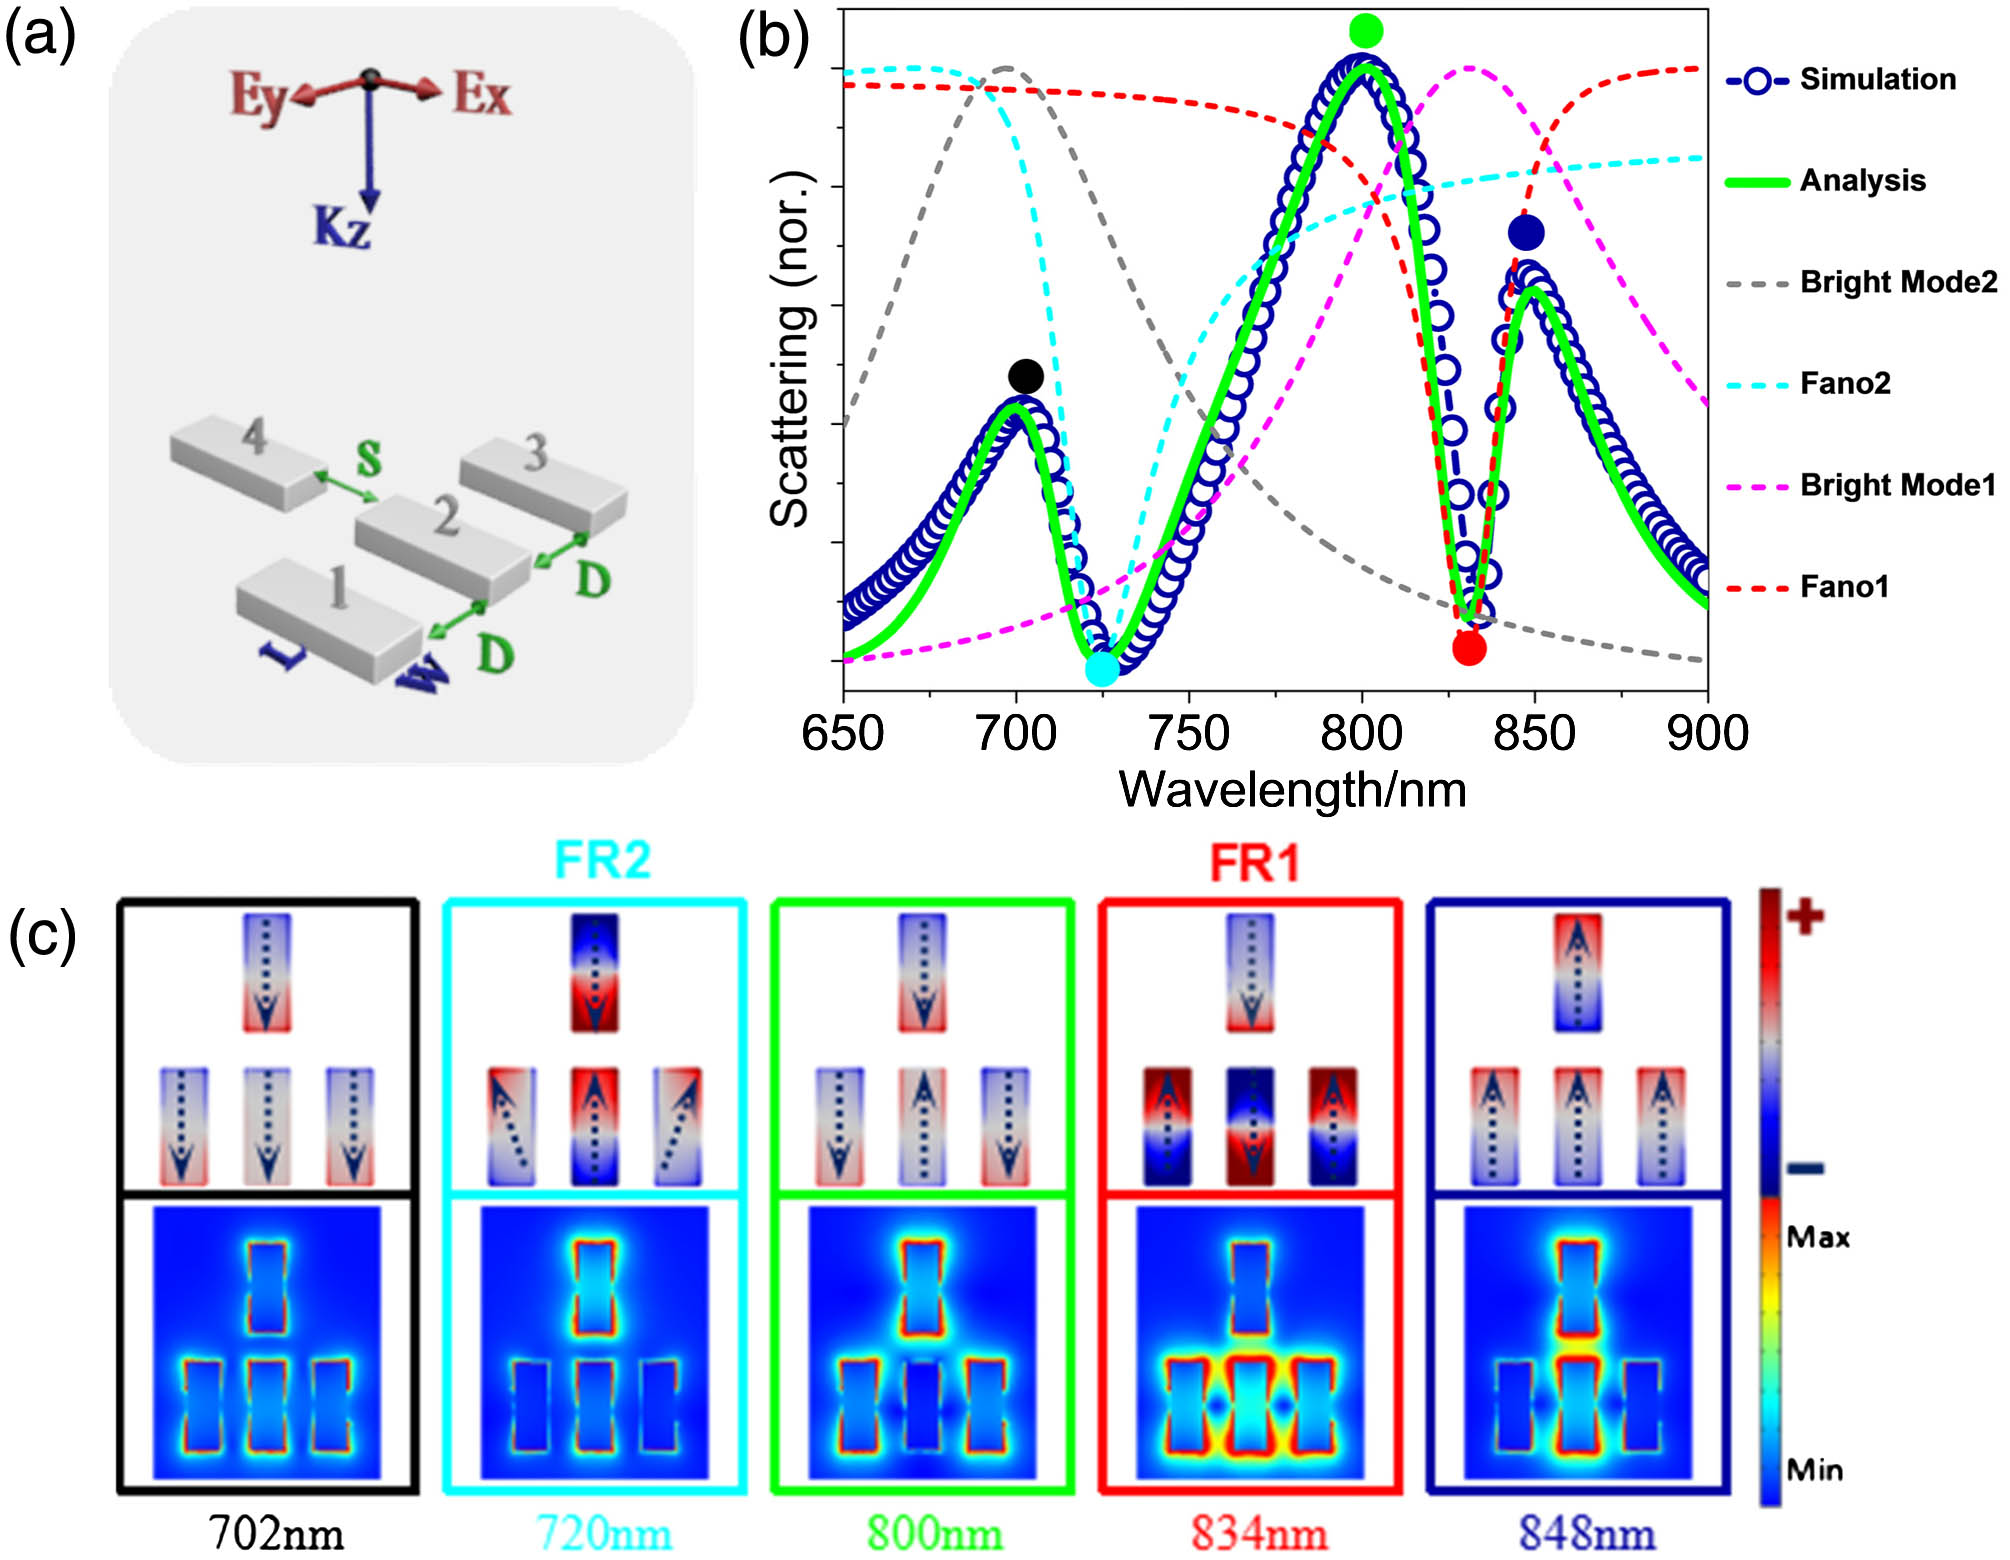
Figure 1(a) displays the schematic of the proposed quadrumer (named as Q1) with specific geometric parameters given in the caption. The four nanobars are named as Bar1, 2, 3, 4 respectively for grouping convenience in the following context. To concentrate on the interaction between nanobars, all of them are chosen to have identical length (100 nm), thickness (16 nm), and width (40 nm), except in Fig. 4(d). The distance between nanobars is set to be and to facilitate practical fabrication either by focused ion beam or electron beam lithography. The incident light is polarized along the direction.
Figure 1.(a) Schematic of the proposed quadrumer system. Geometrical parameters are fixed as (unless otherwise specified) , , thickness , , and . (b) The corresponding numerically obtained scattering spectrum of the system (blue open circles) can be decomposed into two bright modes (gray and purple dashed lines) and two asymmetric Fano modes (cyan and red dashed lines). The green solid line is calculated by the analytical equation (A1) from the Appendix A. (c) Surface charge (top panel) and electric field (bottom panel) distributions at different wavelengths. The color of the frame and the mark spots in (b) are consistent.
The scattering spectrum (blue open circles) acquired by numerical simulations in Fig. 1(b) shows a quite complicated line-shape. To understand its features, we plot the electric field distributions (bottom panel) and surface charges accompanied with arrows pointing to the dipole direction (top panel) of the Q1 system at several special positions in Fig. 1(c). The color framing the charge and electric field distributions is consistent with that of the spot marking the specific position on the spectrum line. Apparently, at 702 nm, the four dipoles oscillate in phase and construct a dominant dipole. The corresponding electric field distribution is relatively weak and average, suggesting that a broad scattering peak can be generated as shown in Fig. 1(b). At 848 nm, the four dipoles also oscillate in-phase, but with a -phase difference compared to at 702 nm. The energy is mainly confined on the central Bar2 and Bar4 at this wavelength. The difference between 702 nm and 848 nm may arise from the ratio between the wavelength and the dimension of the nanostructure.
At 834 nm, Bar2 and Bar4 oscillate in-phase along the direction; this is the opposite direction for Bar1 and Bar3. However, the oscillations of these two groups are antiparallel. The destructive interference between them thus generates a Fano resonance (FR1). It can also be ascribed to the bonding mode formed between Bar1, Bar2, and Bar3 due to the attractive Coulomb interaction of plasmons. In this case, Bar4 functions as to reduce the net dipole moment and causes a steeper dip. Because of the attraction between three anti-parallel oscillated dipoles, the energy is mainly confined in the space between Bar1, Bar2, and Bar3, as shown in the electric field distributions [48].
At 720 nm, Bar1, Bar2, and Bar3 mainly exhibit upward dipole moments contrary to Bar4. Although two imperfect quadrumer modes appear on the outer Bar1 and Bar3, they only contribute to the net dipole moment along the direction because of the structural symmetry. The hybridization between Bar4 and Bar1–3 results in a destructive interference of their radiated fields and generates a second Fano resonance (FR2). The energy is mainly concentrated on Bar4 at this wavelength.
The charge distributions at 800 nm demonstrate that the dipolar modes supported by Bar1, Bar3, and Bar4 oscillate in phase, and by Bar2 out of phase. The large net dipole moment leads to a broad scattering peak at . The electric field distribution displays that the energy is mainly confined on Bar1, Bar3, and Bar4.
We can further analyze the scattering response of the system based on the Eqs. (A1)–(A3) in Appendix A to interpret the origin of FR1 and FR2. As the dashed lines shown in Fig. 1(b), the complicated spectrum can be decomposed into two bright modes and two asymmetric Fano modes. According to the peak position of the two bright modes, we can divide the nanobars into Group1 and Group2, as shown in the top panel in Fig. 2. Specifically, in Group1, the scattering spectrum for the central dimer (Bar2 and Bar4 with end-to-end alignment) exhibits a broad resonance peaked at a similar position to that of the derived bright mode 1 in the Q1 system, confirming that the interference between the in-phase oscillated central dimer (Bar2+Bar4) and the oppositely oscillated outer nanobars (Bar1+Bar3) gives rise to FR1. The width inconsistency may arise from the induction effect from Bar1 and Bar3. On the other hand, the scattering from Bar1+Bar2+Bar3 in Group2 displays a similar peak shape as that of the bright mode 2, although there exists a position discrepancy, revealing that FR2 is caused by the destructive interference between the subgroup Bar1+Bar2+Bar3 and Bar4. The blue-shift of the bright mode 2 may be caused by the repulsive force from Bar4.
Overall, the analysis result (green solid line) obtained by the Eq. (A1) in Appendix A follows the simulated scattering spectrum for the entire system. The peaks of the decomposed two bright modes match well with those of the two subgroups. Furthermore, the analyzed results based on dividing unit cells into different groups are consistent with those on electric charge distributions. Therefore, the analysis model described by the Eqs. (A1)–(A3) is suitable for our system.
C. Polarization Characteristic of Quadrumer System
Figure 3(a) demonstrates the polarization characteristic of Q1 with the incident polarization evolved from to 90°. Obviously, the basic line-shape of the scattering spectrum remains (except at ) for all polarizations. There is not any spectral shift both for the broad resonance shoulder and the two Fano dips. Figure 3(b) illustrates the charge distributions at FR1 (as the example). At , the transverse axis of the four nanobars are excited in-phase, and the Fano resonance cannot be excited. Correspondingly, the scattering intensity shown in Fig. 3(a) is low, and no obvious dip can be observed. When the polarization is rotated by 10°, the charge distribution of the bottom trimer starts to concentrate on their two ends due to the nanobar’s anisotropy. Simultaneously, Bar1, Bar2, and Bar3 oscillate almost out of phase and result in a Fano resonance. The overall scattering intensity is gradually raised with an increase of the polarization angle and reaches the maximum at . This is understandable since the dipole along the direction can be effectively excited when the incident light is polarized along the major axis of the nanobar. In this case, the coupling between nanobars is the strongest, which causes more energy to be stored within interparticle space. The independence of the resonance wavelength on the excitation polarization direction is similar to that shown in the heptamer consisting of seven nanoshells, except for the variation of the scattering intensity [49]. The difference stems from the symmetry of the nanostructures. The polarization-independent feature obviously can provide more excitation tolerance in the experiment.
Figure 2.Simulated scattering spectra for the Q1 system (blue open circles), the bottom trimer (Bar1+Bar2+Bar3, gray solid line), and the middle dimer (Bar2+Bar4, cyan solid line). The decomposed two bright modes are also shown (gray and purple dashed lines) together for comparison.
In this part, we explore the tunability of the two Fano resonances by adjusting the geometric parameters of the Q1 system. The up and bottom panel in Figs. 4(a)–4(d) shows the geometric variations and corresponding spectral responses, respectively. As we have pointed out in the above context, Q1 can provide two Fano resonances originated from two different ways to group the four nanobars. Based on the above analyses, we investigate how the four main parameters affect the scattering spectrum.
Figure 3.(a) Evolution of the scattering spectra of Q1 at normal incidence with different polarization angles, where the 0° (90°) corresponds to the positive direction. (b) The charge distribution of Q1 at FR1 (834 nm) for polarizations at 0°, 10°, 50°, and 90°, respectively.
Figure 4.Scattering spectra of Q1 with (a) varied from 30 nm to 60 nm, (b) varied from 30 nm to 60 nm, (c) varied from 65 nm to 130 nm, and (d) varied from 16 nm to 40 nm. For , please refer to the following Fig. 9(b).
First, we discuss the influence of the distance between the bottom Bar1–3. When is enlarged from 30 nm to 60 nm, the dip at FR1 is blue-shifted quickly, while that at FR2 is almost remained. This can be traced back to Fig. 1(c), which displays that FR1 is originated from the destructive interference of the bottom three nanobars. Therefore, the influence of on FR1 is more pronounced. From the charge distribution of FR1, the bottom three nanobars are attractive to each other. With an increase of , the reduced Coulomb attraction causes the energy of the system to be increased and a blue-shift of FR1. On the other hand, the increase of can weaken the repulsive force between the bottom two outer nanobars (Bar1, Bar3) and the top Bar4, thus enhancing the induction effect from Bar1 and Bar3. Consequently, the downward dipole moment is increased, which can reduce the net dipole moment of the system and result in a deeper dip. At FR2, however, the increase of reduces the repulsive force between the top and bottom nanobars, thus leading to a decrease of the energy and red-shift of the Fano dip. Furthermore, the net dipole moment is raised due to a smaller contribution from the bottom two outer nanobars along the direction, and the dip becomes shallow. Interestingly, from another point of view, it is possible for us to obtain the information about the relative value of the charge distribution, especially for those with contrary sign in the system based on the evolution of the scattering spectrum.
Second, we tune the distance between the central Bar2 and Bar4 from 30 nm to 60 nm. As FR2 is induced by the antibonding mode formed between Bar2 and Bar4, it can be affected more distinctly. With an increase of , the reduced repulsion force between Bar2 and Bar4 can lower the energy of the system and result in a red-shift of FR2. Simultaneously, owing to the weakened cancellation of the dipole moment, the dip becomes shoal. For FR1, the enlarged distance can reduce the contribution from Bar4 and result in a shallow dip.
Third, we push the central Bar2 and Bar4 moving along the direction, and the distance is quantified by [refer to Fig. 9(b) for specific definition]. It is found that with an increase of , the attraction between the central nanobars and the outer two becomes weak, causing the energy of the system to increase and a blue-shift of the dip at FR1. Easy to understand, the increase of can also reduce the influence from the two bottom outer nanobars, which can cancel the net dipole moment of FR2. Therefore, we can observe a shoaling process of its dip.
Figure 4(d) presents the dependence of the Fano resonances on the thickness of the nanobars. An increase of the thickness corresponds to a decrease of the effective aspect ratio of the nanobars. Thus, we can observe an obvious blue-shift of both FR1 and FR2.
All in all, the above results demonstrate that the two Fano resonances in our proposed Q1 system are caused by different subgroups of nanobars and that they can be tuned independently or simultaneously, including the spectral line-shape, dip position, and depth of the dip. These particular features of the system offer us a platform to realize various applications in different research fields.
E. Origin of High FoM in the Q1 System
We calculated the scattering spectra of the Q1 system in a different embedding medium as shown in Fig. 5(a). They are red-shifted with an increase of the refractive index. The corresponding FoMs are plotted in Fig. 6, in which the black solid line represents the theoretically calculated results by the Eq. (1). As seen, the FoM in the proposed Q1 system is 45 with a refractive index of 1.42. This value is much higher than that in a relatively complicated dual-disk ring Ag nanostructure () [38]. In this part, we try to find the underlying physical mechanism and investigate its connection between the Q1 system and the conventional quadrumer [4,17,21].
Figure 5.Scattering spectra of the (a) Q1, (b) Q2, and (c) pentamer systems as a function of the refractive index of the surrounding medium.
Figure 6.FoMs of FR1 for the Q1, Q2, and pentamer systems, which are calculated based on the scattering spectra shown in Figs. 5(a)–5(c). Please note that not all the scattering spectra are shown there. The black solid line represents the theoretical value obtained by the Eq. (1).
At first, based on the conventional quadrumer system with circular unit cells proposed by Capasso et al.[4,17,21], we modify the unit cell to be a rectangular nanobar, which is consistent with that in Q1, as shown in Fig. 7(a) (Q2 system). The nanobars are symmetrically arranged along the and directions. Figure 7(b) displays the scattering spectrum with the polarization along the direction. As can be observed, a typical Fano-type resonance (blue open circles) is generated at 766 nm. Based on the Eqs. (A2) and (A3) in Appendix A, the scattering spectrum of Q2 can also be decomposed easily into one bright mode (gray dashed line) and one asymmetric Fano mode (cyan dashed line), respectively. The green solid line represents the analysis data calculated by the Eq. (A1). Obviously, the simulation result matches well with the analysis data. The electric field and charge distributions shown in Fig. 8 are similar to those reported in the circular disk quadrumer [4,17], revealing that the spectrum response of the system is not very sensitively dependent on the shape of the unit cell.
Figure 7.(a) Schematic of the quadrumer 2 (Q2) system. Geometrical parameters are chosen as the same as those in Fig. 1(a). (b) The corresponding numerically obtained scattering spectrum of the system (blue open circles) can be decomposed into a bright mode (gray dashed line) and an asymmetric Fano mode (cyan dashed line). The green solid line represents the analysis data calculated by the Eq. (A1) in Appendix A.
Figure 8.(a) Simulated scattering spectrum of the Q2 system (blue open circles) can be decomposed into one bright mode (gray dashed line) and one asymmetric Fano mode (red dashed line). The cyan solid line plots the simulated scattering spectrum from the middle dimer, while the green solid line indicates the analyzed data. (b) Corresponding surface charge (top panel) and electric field (bottom panel) distributions at different wavelengths.
The Fano resonance in Q1 is originated from the symmetry reducing from in Q2 to [4]. Based on this configuration, we reduce the symmetry further by pushing the two central nanobars away from the symmetric center [corresponds to as shown in Fig. 9(b)] along the direction. Our simulation results [Fig. 9(a)] show that when the two central nanobars are pushed only 4 nm away from the symmetric center, a new dip (although very shallow) appears at the blue side of the origin Fano resonance (FR1). Accompanied with the formation of the new dip, FR1 is squeezed and red-shifted. With an increase of , the new dip shifts to blue very slowly, while FR1 redshifts quickly. We choose three typical distances to investigate the electric charge distributions at both dips, as shown in Fig. 9(b). It can be seen that the pattern of the charge distribution for FR1 remains similar, that is, the outer and central two dipoles oscillate out of phase. With the central nanobars being pushed further, the bottom three nanobars start to attract each other, which shifts the dip to the red side. For the new generated dip, it is different. The two dipoles formed on the two central nanobars are antiparallel. Due to the concentrated negative charges near the symmetric center, positive charges are induced correspondingly, forming an inner and outer quadrupole. The outer quadrupole disappears when . Furthermore, the push of the two central nanobars causes their charge distribution to point reversely and repel each other. From the scattering spectra, we can observe a consistent blue-shift of the dip. When , the structure of Q2 evolves to Q1. Therefore, from the evolution process, the high FoM of Q1 at FR1 can be attributed to the squeezing effect of FR2.
Figure 9.(a) Evolution of the simulated scattering spectra of the quadrumer by pushing the two central nanobars along the direction. defines the pushing distance away from the symmetric center along the direction. (b) Calculated distribution of surface charges with , 16, and 48 nm, respectively. The top panel framed by dashed lines corresponds to the shorter wavelength dip, while the bottom panel corresponds to the longer one. FR2 disappears when .
Based on the scattering spectrum shown in Fig. 5(b), we also calculated the FoMs of the Q2 system and plot them in Fig. 6 for comparison. Obviously, they are lower than those in the Q1 system.
On the other hand, the FoM of the system can also be improved by increasing the complexity of the plasmonic nanostructures. For example, if we introduce one more identical nanobar into the system, the Q1 system evolves from a quadrumer to a pentamer. Without loss of generality, we put two identical nanobars in the upper middle of Bar1, Bar2, and Bar3, as shown in Fig. 10(a). All the gap distances are kept identical. Although the scattering spectrum of the pentamer shown in Fig. 10(b) looks quite different from that of Q1 in terms of the line-shape, it still can be decomposed into two bright modes and two asymmetric Fano modes. The bright mode of FR2 is also originated from the bottom trimer, while that of FR1 from the bottom-central one combined with the top two, as demonstrated in Fig. 11. The resonance linewidth of FR1 is narrowed down to 10 nm compared to 14 nm in the Q1 system, which may arise from the system centroid moving of the nanostructure after the introduction of the top two nanobars. The FoM is increased to approach the material limit (refer to Fig. 6).
Figure 10.(a) Schematic of the pentamer. The unit cells are the same as those in Q1. . (b) The corresponding simulated scattering spectrum can also be decomposed into two bright modes and two asymmetric Fano modes. The color and line styles are consistent with those in Fig. 1(b). (c) Calculated surface charge and electric field distributions of the pentamer at FR1 and FR2, respectively.
Figure 11.Simulated scattering spectra for the pentamer system (blue open circles), the bottom trimer (green solid line), and the top dimer combined with the bottom central nanobar (cyan solid line). The decomposed two bright modes are also shown (gray and purple dashed lines) together for comparison.
We then plot the field and charge distributions at the two Fano resonances in Fig. 10(c). It can be found that the charge distribution, especially on the bottom trimer, is similar to that in the Q1 system. At FR1, the charge distribution on the top nanobar evolves from a dipolar mode into two imperfect quadrumer modes, which can be ascribed to the induction from the bottom trimer. Colligating the effect of the two imperfect quadrumer modes, the contribution to the dipole moment is actually zero because of their antiparallel direction along the and directions. Consequently, the dipole moment cannot be cancelled effectively, and the dip is even shallower than that in Q2, not to mention Q1. If we shrink the distance between the upper two nanobars from 30 nm to 20 nm (keep the position of the centroid), the influence of the outer two bottom nanobars is weakened, resulting in a steeper dip, as shown in Fig. 12.
Figure 12.Simulated scattering spectra for the pentamer system in which the blue (green) solid line represents (20 nm). Other geometric parameters are the same as in Figs. 1 and 10.
We have proposed a novel Ag quadrumer that can provide two polarization-independent Fano resonances. They can either be tuned independently or simultaneously, simply by tuning the geometrical parameters. Specially, the formation of the two resonances can make one of them squeezed spectrally, which leads to a very high FoM at the near-infrared window. The complicated scattering spectrum can be decomposed into bright and dark modes. By analyzing the evolution of the scattering responses and the electric charge distributions with the position shift of central nanobars, the two Fano resonances are found to be originated from the symmetry breaking of the conventional quadrumer. When another nanobar is introduced into the quadrumer system, its FoM can reach the material’s limit under quasi-static approximation.
The quadrumer system demonstrated in this paper is highly feasible to be realized experimentally since the smallest distance between nanobars is 30 nm. Our method for dividing unit cells into different groups, which generate multiple Fano resonances, respectively, can provide new solutions in the applications for plasmonic photocatalysis, nanolasers, and medical or biochemical sensors, etc.
APPENDIX A
In the formula based on ab initio theory to reveal the roles played by the electromagnetic modes and material losses in the metallic nanostructures [46], the Fano resonance is built from the interference between a radiative symmetric resonance (bright) mode and a nonradiative asymmetric resonance (dark) mode that spectrally and spatially overlap [16,47]. The scattering cross section of the system can be described as where the superscript , indicates the decomposed th (th) asymmetric (symmetric) sub-spectrum . and can be expressed as [47] where is the frequency and is the central frequency of the bright (dark) mode resonance. is the spectral linewidth of the symmetric (asymmetric) sub-spectrum, and a is the relative amplitude of the resonance. describes the asymmetric factor and the damping coefficient, which is proportional to the intrinsic loss.