
Yingchun Sun, Shuguo Pan, Tao Zhao, Wang Gao, Jiansheng Wei. Traffic Light Detection Based on Optimized YOLOv3 Algorithm[J]. Acta Optica Sinica, 2020, 40(12): 1215001
- Acta Optica Sinica
- Vol. 40, Issue 12, 1215001 (2020)
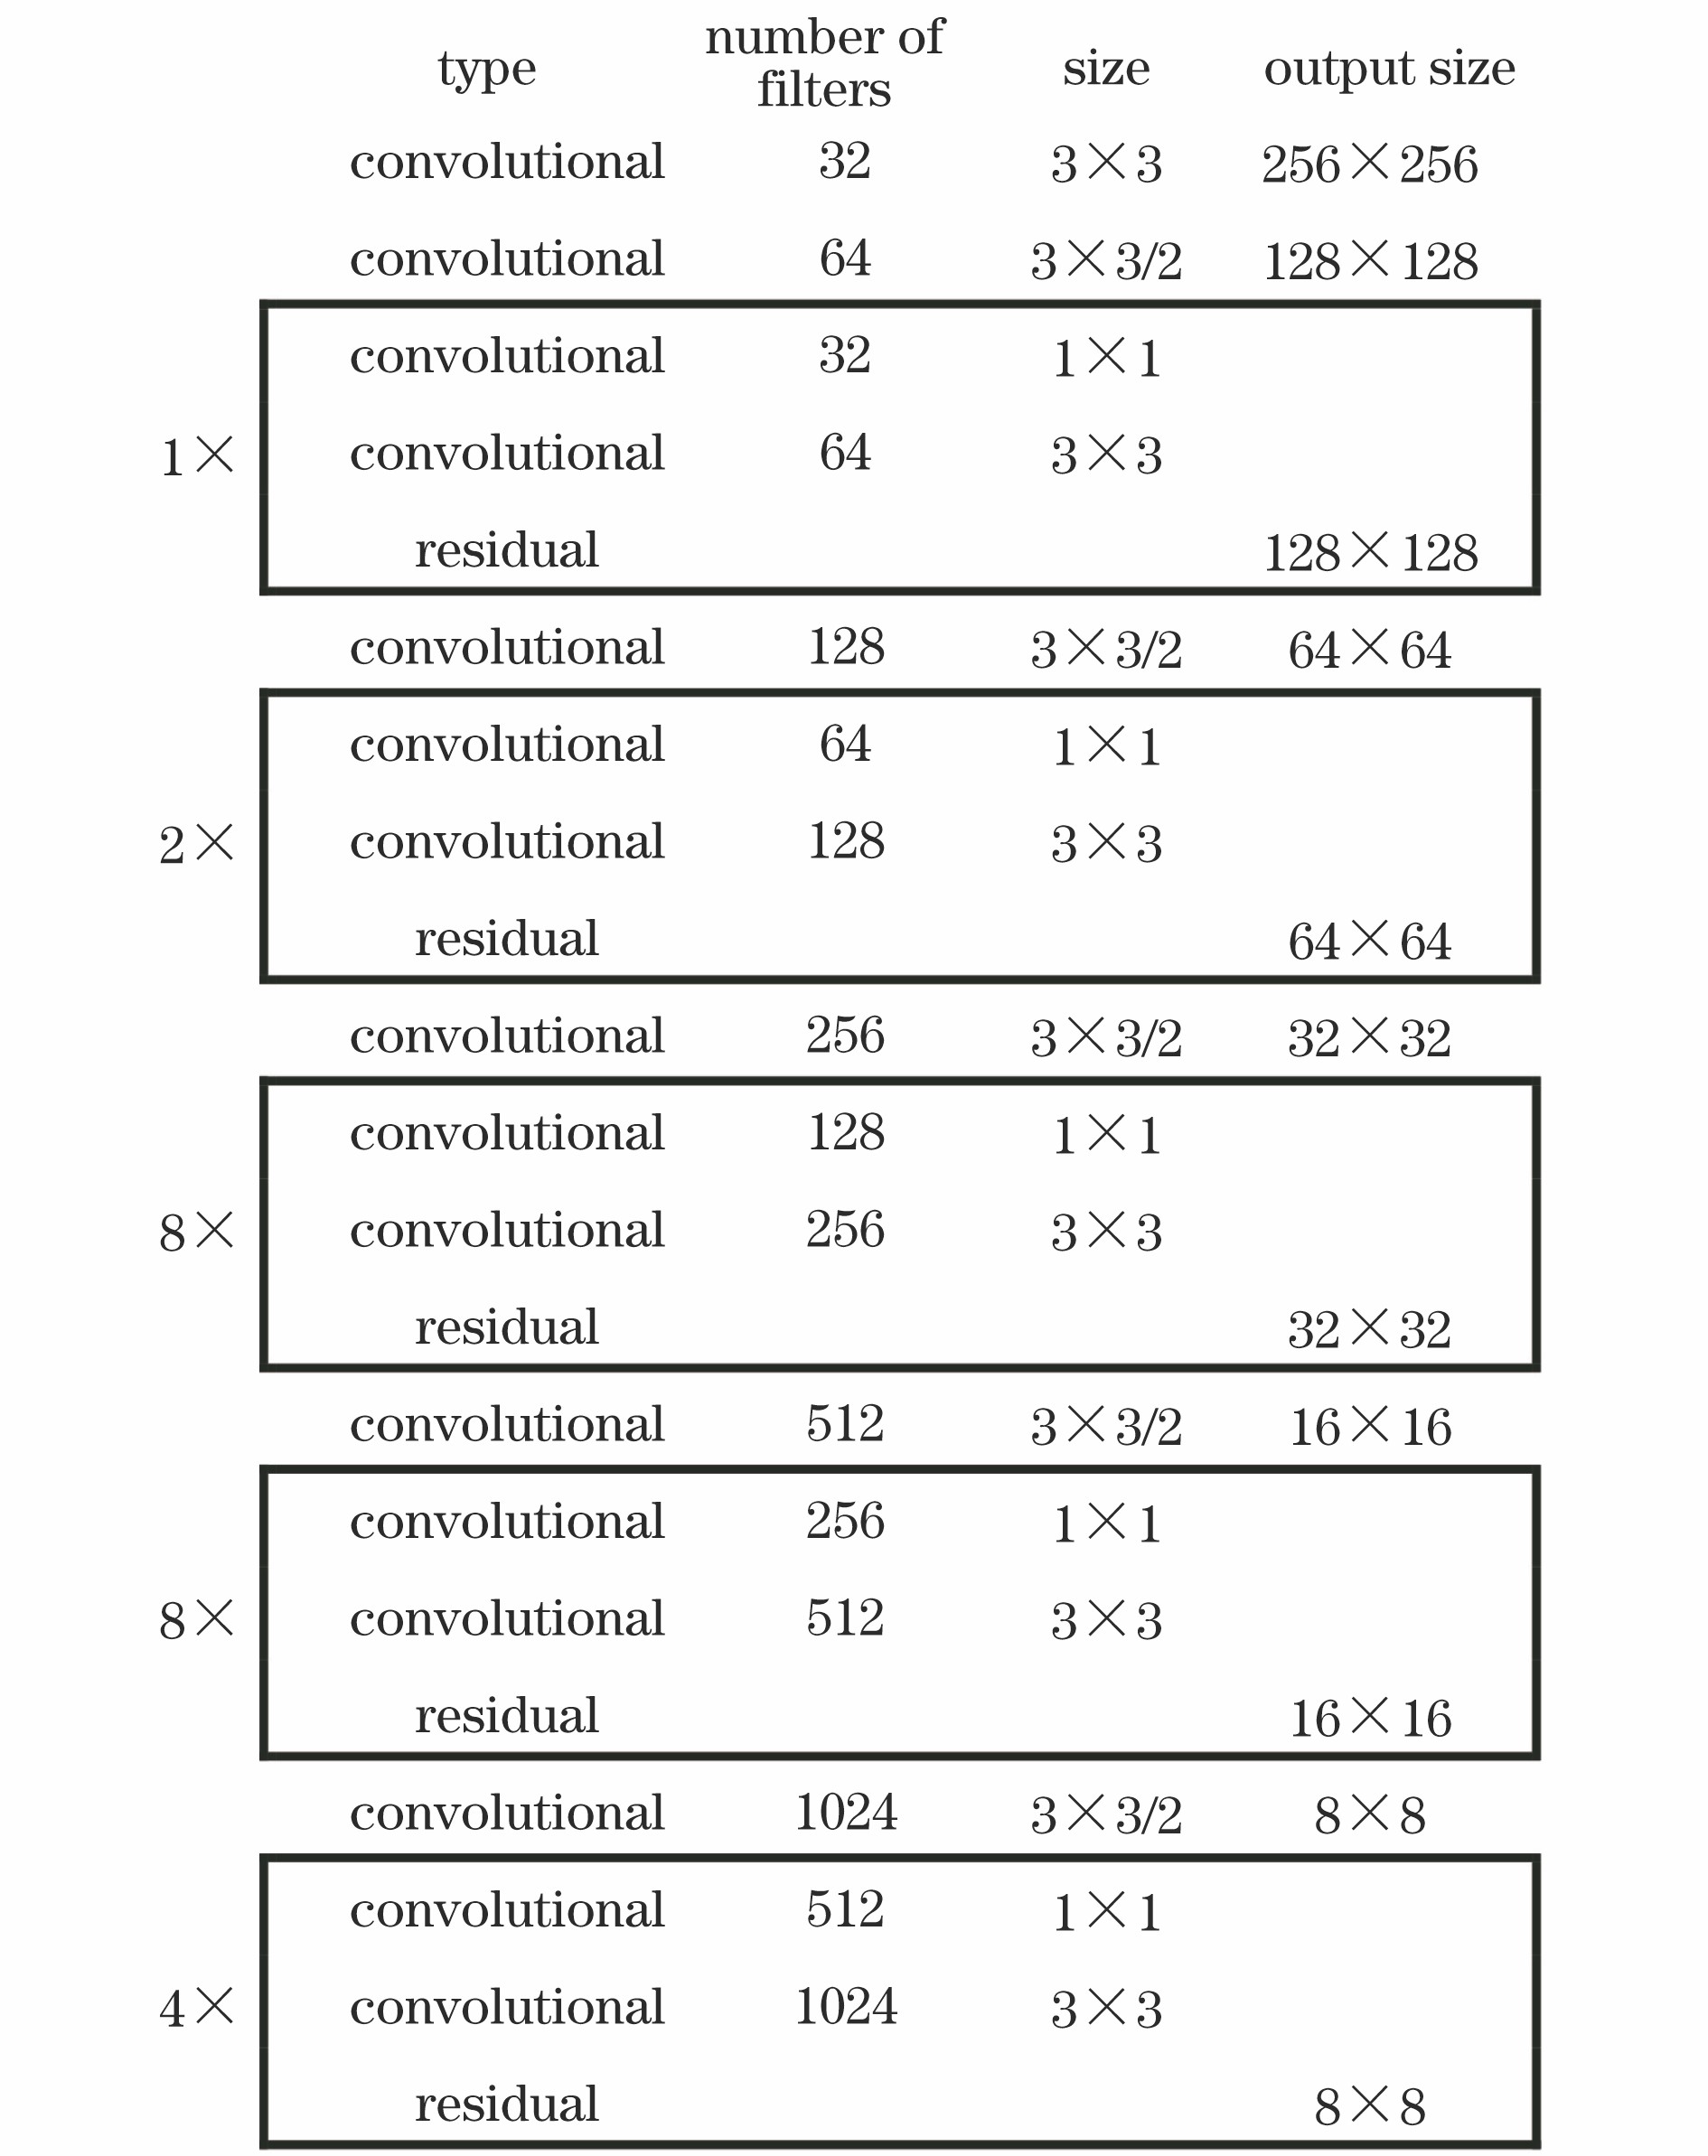
Fig. 1. Relative parameters of Darknet-53
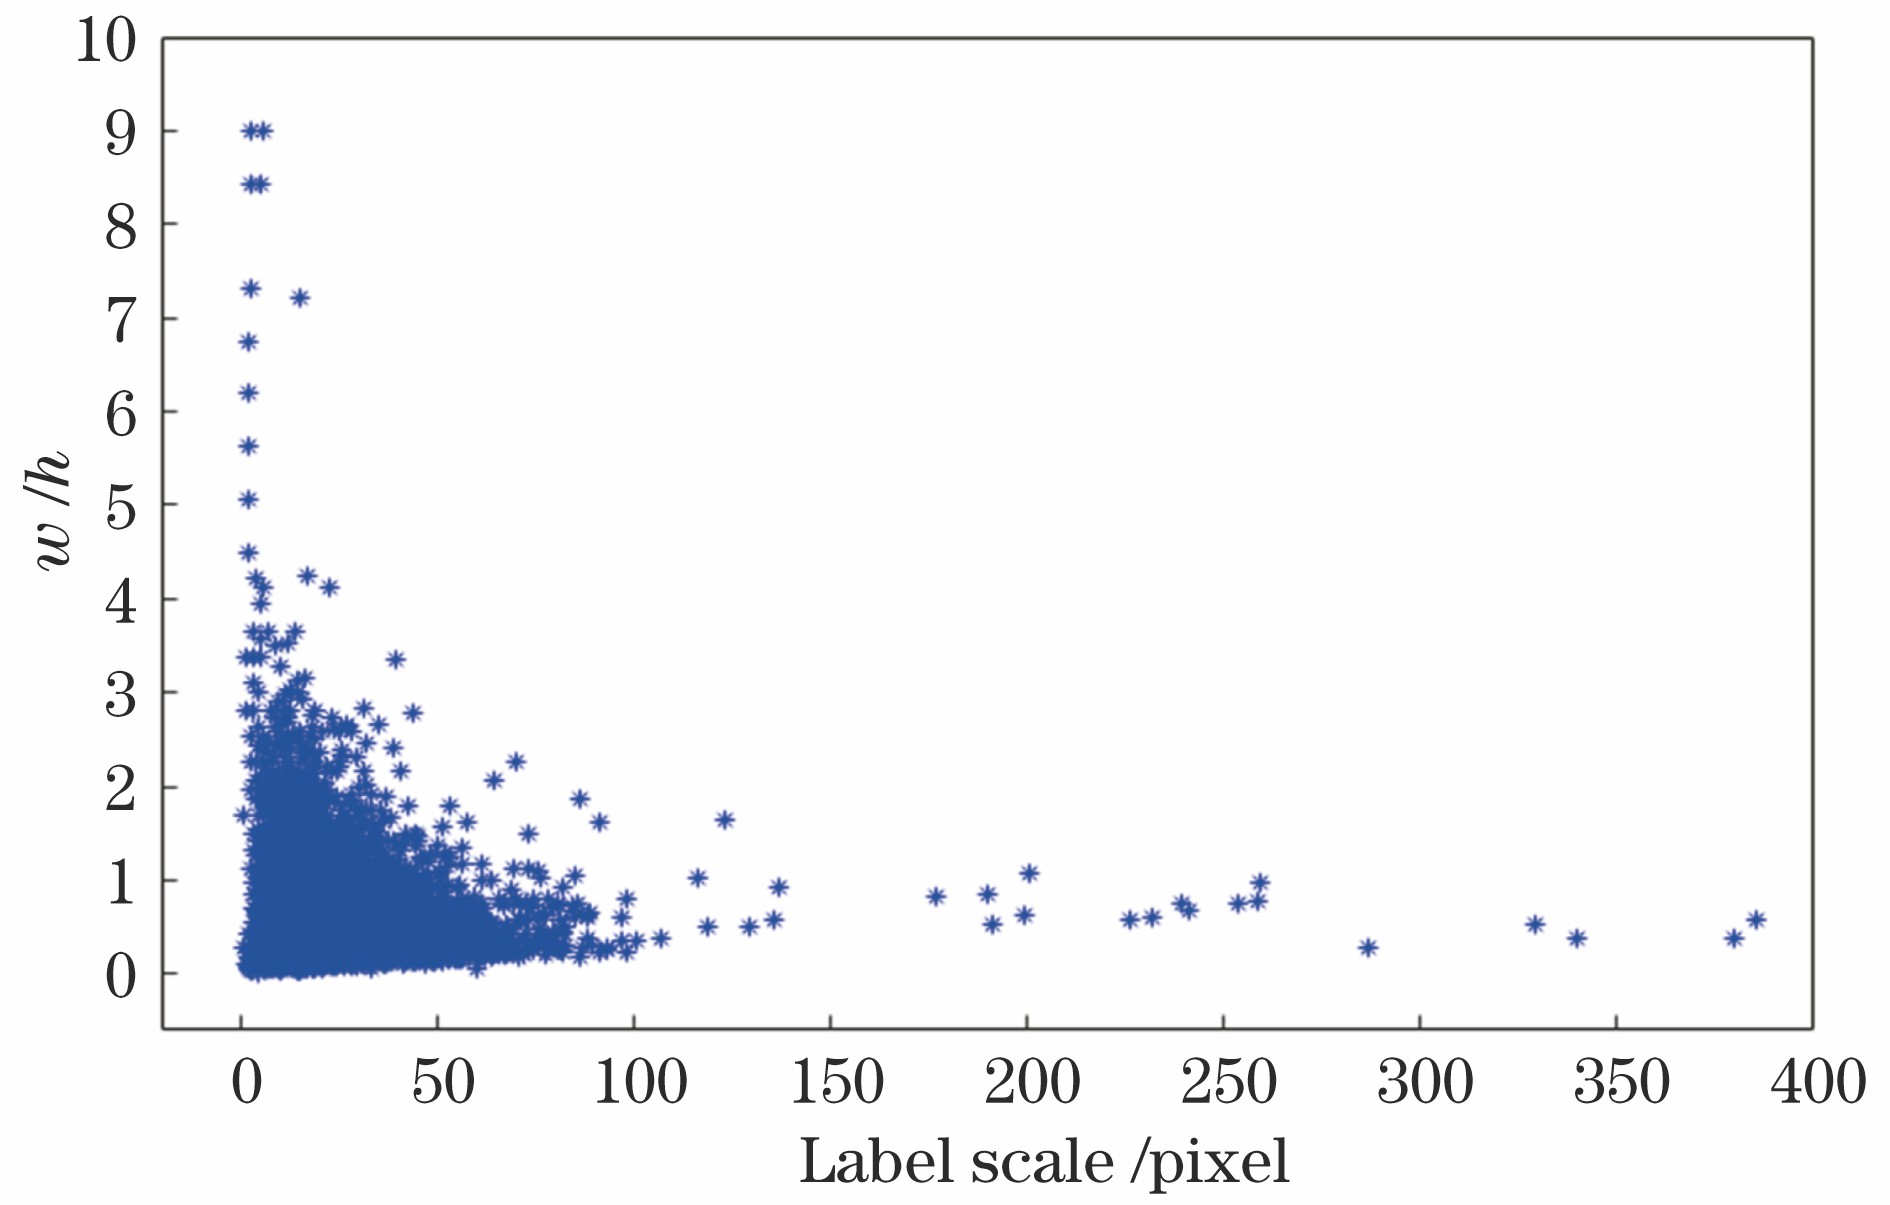
Fig. 2. Distribution of traffic light label
Fig. 3. Result of clustering analysis
Fig. 4. Optimized YOLOv3 network structure
Fig. 5. Average loss function curve of optimized YOLOv3 algorithm
Fig. 6. Average IOU curve of optimized YOLOv3 algorithm
Fig. 7. Detection results of traffic lights by each network. (a)(c) Detection results of YOLOv3 network; (b)(d) detection results of optimized YOLOv3 network
Fig. 8. AP curve of YOLOv3 network
Fig. 9. AP curve of optimized YOLOv3 network
Fig. 10. Comparison of average precision under different scenes and object sizes
Fig. 11. Comparison of detection results. (a) Detection results of YOLOv3 algorithm; (b) detection results of optimized YOLOv3 algorithm
|
Table 1. Clustering results under different k values
|
Table 2. Comparison of total object detection results
| |||||||||||||||||||||||||||
Table 3. Detection precision, recall, and average precision under different object sizes
| |||||||||||||||||||||||||||||||||||||||||||||||||||
Table 4. Detection precision, recall, and average precision under different scenes


Set citation alerts for the article
Please enter your email address

© Copyright 2018-2021 | Chinese Laser Press. All Rights Reserved 沪ICP备15018463号-20