
Min Lu, Zhile Wang, Shuqing Zhang, Pingping Gao, Xiaobo He. Polarization Scattering Characterization and Discrimination Principle of Surface Defects[J]. Acta Optica Sinica, 2021, 41(12): 1229001
- Acta Optica Sinica
- Vol. 41, Issue 12, 1229001 (2021)
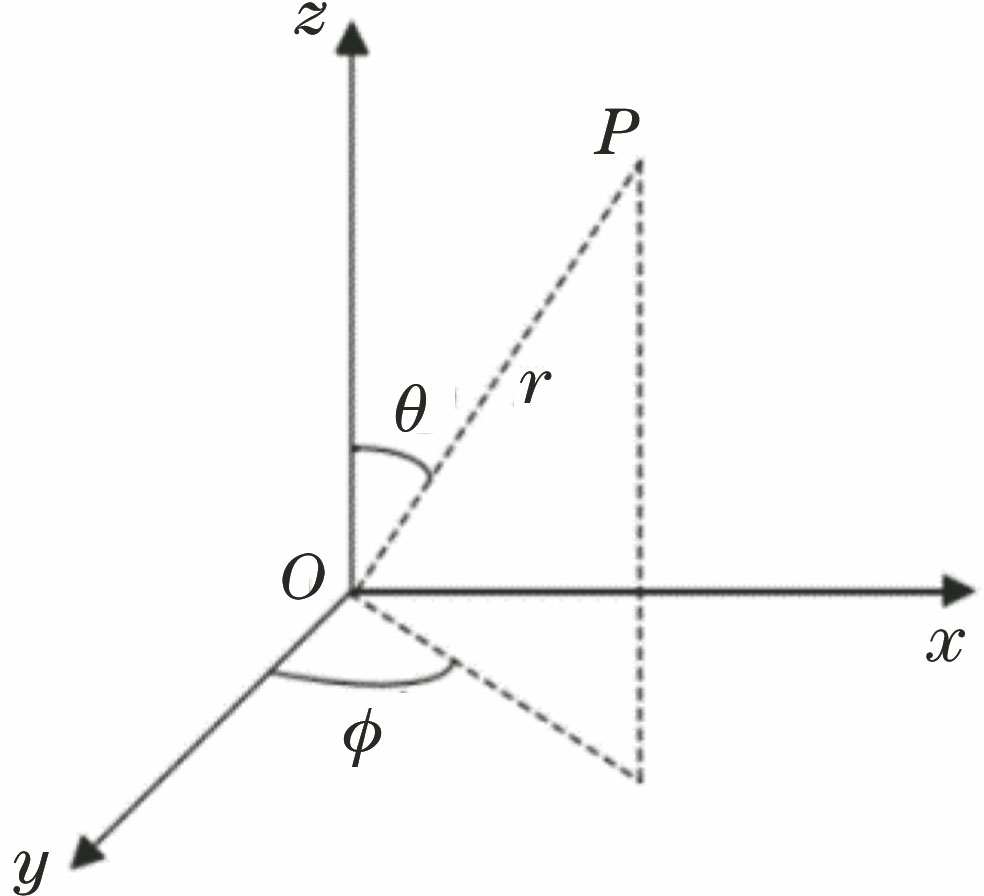
Fig. 1. Schematic diagram of Mie scattering spatial relationship
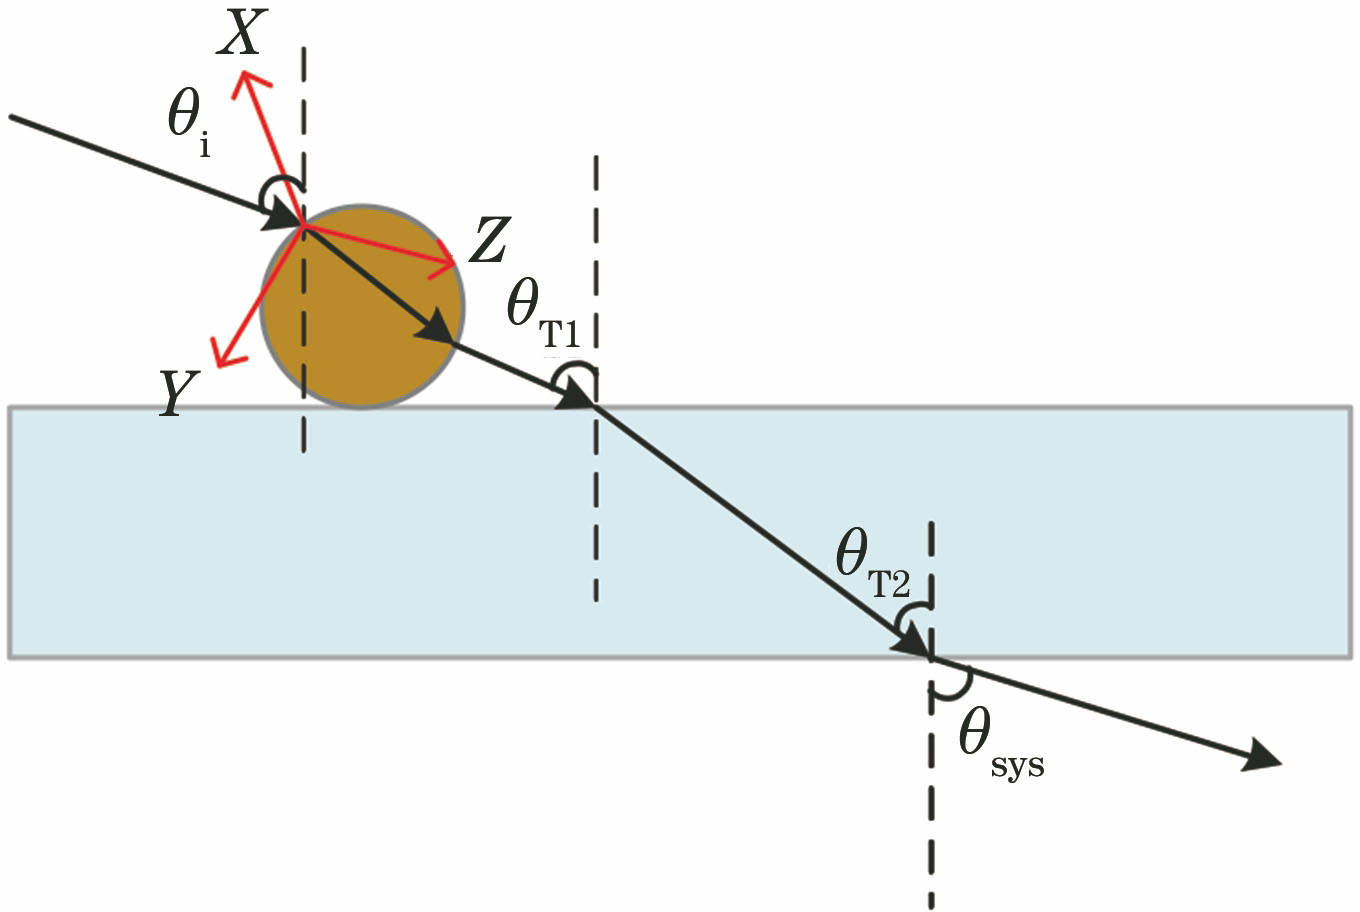
Fig. 2. Surface particle dust light diagram
Fig. 3. Surface dig light diagram
Fig. 4. Influence of different refractive indexes with three types of particle size on m33 values of particle contamination and dig. (a) 1 μm; (b) 5 μm; (c) 10 μm
Fig. 5. Influence of different real part of contamination refractive indexes with three types of different particle sizes on m33values of particle contamination. (a) 1 μm; (b) 5 μm; (c) 10 μm
Fig. 6. Influence of different imaginary part of contamination refractive indexes with three types of particle size on m33values of particle contamination. (a) 1 μm; (b) 5 μm; (c) 10 μm
Fig. 7. Influence of D/λ on m33 values of particle contamination and dig. (a) D/λ=25/12; (b) D/λ=25/6; (c) D/λ=25/3
Fig. 8. Influence of D/λ on absolute difference of Mueller values of particle contamination and dig. (a) Absolute difference of m12; (b) absolute difference of m33; (c) absolute difference of m34
Fig. 9. Influence of incident angles on m33. (a) Particle contamination; (b) dig
Fig. 10. Influence of incident angles on absolute difference of Mueller values of particle contamination and dig. (a) Absolute difference of m12; (b) absolute difference of m33; (c) absolute difference of m34
Fig. 11. Experimental schematic diagram
Fig. 12. Comparison of simulation results with experimental results. (a) 20°; (b) 60°

Set citation alerts for the article
Please enter your email address
© Copyright 2018-2021 | Chinese Laser Press. All Rights Reserved 沪ICP备15018463号-20