• Spectroscopy and Spectral Analysis
  • Vol. 42, Issue 3, 904 (2022)
Jun WANG1、1;, Zhou-li WANG2、2;, and Jing-jing CHENG1、1;
Author Affiliations
  • 11. College of Food and Drug, Xuchang University, Xuchang 461000, China
  • 22. College of Food Science and Engineering, Northwest A&F University, Yangling 712100, China
  • show less
    DOI: 10.3964/j.issn.1000-0593(2022)03-0904-06 Cite this Article
    Jun WANG, Zhou-li WANG, Jing-jing CHENG. Interaction Between Tartrazine and Bovine Serum Albumin Using Multispectral Method and Molecular Docking[J]. Spectroscopy and Spectral Analysis, 2022, 42(3): 904 Copy Citation Text show less
    Fluorescence spectra of tartrazine-BSA (293 K) c(BSA)=5×10⁻⁷ mol·L-1; c(tartrazine)(from up to down)=(0, 1, 2, 3, 4, 5)×10-7 mol·L-1
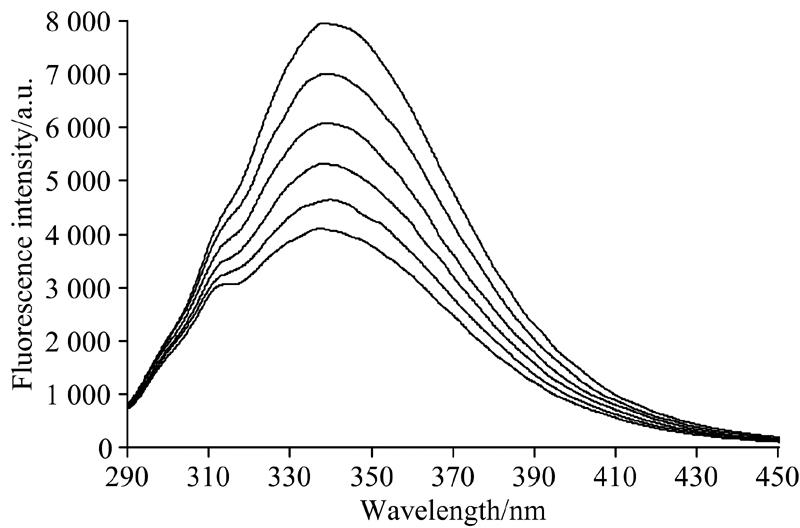
    Fig. 1. Fluorescence spectra of tartrazine-BSA (293 K) c(BSA)=5×10⁻⁷ mol·L-1; c(tartrazine)(from up to down)=(0, 1, 2, 3, 4, 5)×10-7 mol·L-1
    Stern-Volmer curve for the fluorescence quenching of BSA by tartrazine
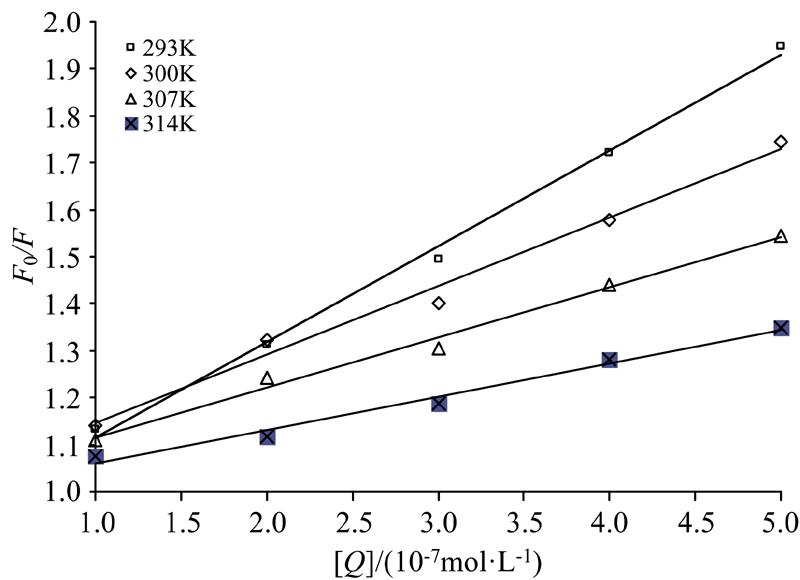
    Fig. 2. Stern-Volmer curve for the fluorescence quenching of BSA by tartrazine
    lg[(F0-F)/F]-lg[Q] curve at different temperatures
    Fig. 3. lg[(F0-F)/F]-lg[Q] curve at different temperatures
    Fluorescence spectra of BSA and UV spectra of tartrazine c(BSA)=5×10⁻⁷ mol·L-1; c(tartrazine)=5×10⁻⁷ mol·L-1
    Fig. 4. Fluorescence spectra of BSA and UV spectra of tartrazine c(BSA)=5×10⁻⁷ mol·L-1; c(tartrazine)=5×10⁻⁷ mol·L-1
    Synchronous fluorescence spectra of tartrazine and BSA c(BSA)=5×10⁻⁷ mol·L-1; c(tartrazine)(from up to down)=(0, 1, 2, 3, 4, 5)×10-7 mol·L-1(a): Δλ=15 nm; (b): Δλ=60 nm
    Fig. 5. Synchronous fluorescence spectra of tartrazine and BSA c(BSA)=5×10⁻⁷ mol·L-1; c(tartrazine)(from up to down)=(0, 1, 2, 3, 4, 5)×10-7 mol·L-1
    (a): Δλ=15 nm; (b): Δλ=60 nm
    Three dimensional fluorescence spectra of BSA and tartrazine-BSA(a): c(BSA)=5×10⁻⁷ mol·L-1; (b): c(BSA)=5×10⁻⁷ mol·L-1; c(tartrazine)=5×10⁻⁷ mol·L-1
    Fig. 6. Three dimensional fluorescence spectra of BSA and tartrazine-BSA
    (a): c(BSA)=5×10⁻⁷ mol·L-1; (b): c(BSA)=5×10⁻⁷ mol·L-1; c(tartrazine)=5×10⁻⁷ mol·L-1
    UV spectra of tartrazine and BSA c(BSA)=5×10⁻⁷ mol·L-1; c(tartrazine)(from down to up)=(0, 1, 2, 3, 4, 5)×10-7 mol·L-1
    Fig. 7. UV spectra of tartrazine and BSA c(BSA)=5×10⁻⁷ mol·L-1; c(tartrazine)(from down to up)=(0, 1, 2, 3, 4, 5)×10-7 mol·L-1
    Structure of BSA and tartrazine
    Fig. 8. Structure of BSA and tartrazine
    Molecular docking simulation of tartrazine and BSA(a): Molecular docking of tartrazine and BSA;(b): Amino acid residues around tartrazine
    Fig. 9. Molecular docking simulation of tartrazine and BSA
    (a): Molecular docking of tartrazine and BSA;(b): Amino acid residues around tartrazine
    T/KStern-Volmer回归方程相关系数R2KSV/(L·mol-1)Kq/(L·mol-1·s-1)
    293y=0.203 9x+0.910 30.996 52.039×1062.039×1014
    300y=0.146 3x+0.998 70.988 31.463×1061.463×1014
    307y=0.106 8x+1.0080.991 01.068×1061.068×1014
    314y=0.070 9x+0.988 90.987 67.090×1057.090×1013
    Table 1. Stern-Volmer linear equations and correlation coefficients
    T/K回归方程相关系数R2KA/(L·mol-1)结合位点数n
    293y=1.216x+7.6370.999 74.335×1071.216
    300y=1.001x+6.1670.988 61.469×1061.001
    307y=0.978 1x+5.8980.990 37.907×1050.978 1
    314y=0.980 8x+5.6990.978 45.000×1050.980 8
    Table 2. Binding constant KA at different temperatures and number of binding point
    T/
    K
    ΔH/
    (kJ·mol-1)
    ΔS/
    (J·mol-1·K-1)
    ΔG/
    (kJ·mol-1)
    293-42.84
    300-154.5-387.8-35.42
    307-34.66
    314-34.26
    Table 3. Thermodynamic parameters of tartrazine-BSA interaction at different temperatures
    体系组分peak 1
    λex/λem, F
    peak 2
    λex/λem, F
    ABSA280/336, 7 604230/338, 6 484
    BBSA+柠檬黄280/336, 4 280230/336, 3 669
    Table 4. Characteristic parameters of three-dimensional fluorescence spectra
    Jun WANG, Zhou-li WANG, Jing-jing CHENG. Interaction Between Tartrazine and Bovine Serum Albumin Using Multispectral Method and Molecular Docking[J]. Spectroscopy and Spectral Analysis, 2022, 42(3): 904
    Download Citation