
Hui Bai, Fengbao Yang. LiDAR Data Classification Method Based on High Recognition Compound Derivative Feature[J]. Laser & Optoelectronics Progress, 2021, 58(5): 0528001
- Laser & Optoelectronics Progress
- Vol. 58, Issue 5, 0528001 (2021)
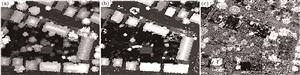
Fig. 1. Source feature images of airborne LiDAR data. (a) First echo height; (b) last echo height; (c) echo intensity
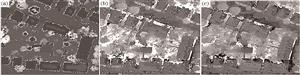
Fig. 2. Derivative features of airborne LiDAR data. (a) Elevation difference; (b) NDVI; (c) GNDVI
Fig. 3. Relationship between GNDVI and total chlorophyll concentration[10]
Fig. 4. Ridge trust allocation function
Fig. 5. GRNDVI value and classification accuracy change curve. (a) Curves of classification accuracy changes of buildings and roads; (b) curves of classification accuracy changes of trees and grasslands; (c) average classification accuracy
Fig. 6. Classification results of different vegetation indexes based on fuzzy DS. (a) Visible light images; (b) artificial data; (c) classification results based on NDVI and fuzzy DS; (d) classification results based on GNDVI and fuzzy DS; (e) classification results based on GRNDVI and basic DS; (f) classification results based on GRNDVI and fuzzy DS
| |||||||||||||||||
Table 1. Complementary sets of distinguishing features
|
Table 2. Comparison groups of different vegetation index characteristics experiments and different DS methods
|
Table 3. Classification accuracy of data set 1
|
Table 4. Classification accuracy of data set 2
|
Table 5. Classification accuracy of data set 3
|
Table 6. Classification accuracy of data set 4
|
Table 7. Classification accuracy of data set 5

Set citation alerts for the article
Please enter your email address
© Copyright 2018-2021 | Chinese Laser Press. All Rights Reserved 沪ICP备15018463号-20