• Chinese Optics Letters
  • Vol. 22, Issue 2, 022702 (2024)
Rui-Rui Li1、2, Wei-Ran Ye1、2, Yi-Long Chen1、2, Shu-Qian Chen1、2, Wen-Hao Qi1、2, Jin-Ming Cui1、2、3, Yun-Feng Huang1、2、3、*, Chuan-Feng Li1、2、3, and Guang-Can Guo1、2、3
Author Affiliations
  • 1CAS Key Laboratory of Quantum Information, University of Science and Technology of China, Hefei 230026, China
  • 2CAS Center for Excellence in Quantum Information and Quantum Physics, University of Science and Technology of China, Hefei 230026, China
  • 3Hefei National Laboratory, University of Science and Technology of China, Hefei 230088, China
  • show less
    DOI: 10.3788/COL202422.022702 Cite this Article Set citation alerts
    Rui-Rui Li, Wei-Ran Ye, Yi-Long Chen, Shu-Qian Chen, Wen-Hao Qi, Jin-Ming Cui, Yun-Feng Huang, Chuan-Feng Li, Guang-Can Guo. Generation of visible Raman operation laser by a fiber electro-optical modulator feedback loop[J]. Chinese Optics Letters, 2024, 22(2): 022702 Copy Citation Text show less
    (a) Schematic of the experimental setup. Some concerned ports of the FFS chip and the VCO chip are marked by italics in the figure. (b) Energy level schematic of the 171Yb+ qubits. The energy levels associated with the stimulated Raman transition (SRT). Here, we utilize two 532 nm optical fields with a frequency difference of 12.64 GHz to implement the SRT. The transition wavelength for Doppler cooling is 369.5 nm. ML, monochromatic laser; FEOM, fiber electro-optic modulator; YDFA, ytterbium-doped fiber amplifier; BS, beam splitter; PPLN, periodically polarized lithium niobate; LNA, low-noise amplifier; FPD, fast photoelectric detector; VCO, voltage-controlled oscillator; ERS, external reference signal; PS, power splitter; SA, spectrum analyzer; FFS, fractional-N frequency synthesizer; FPI, Fabry–Pérot interferometer.
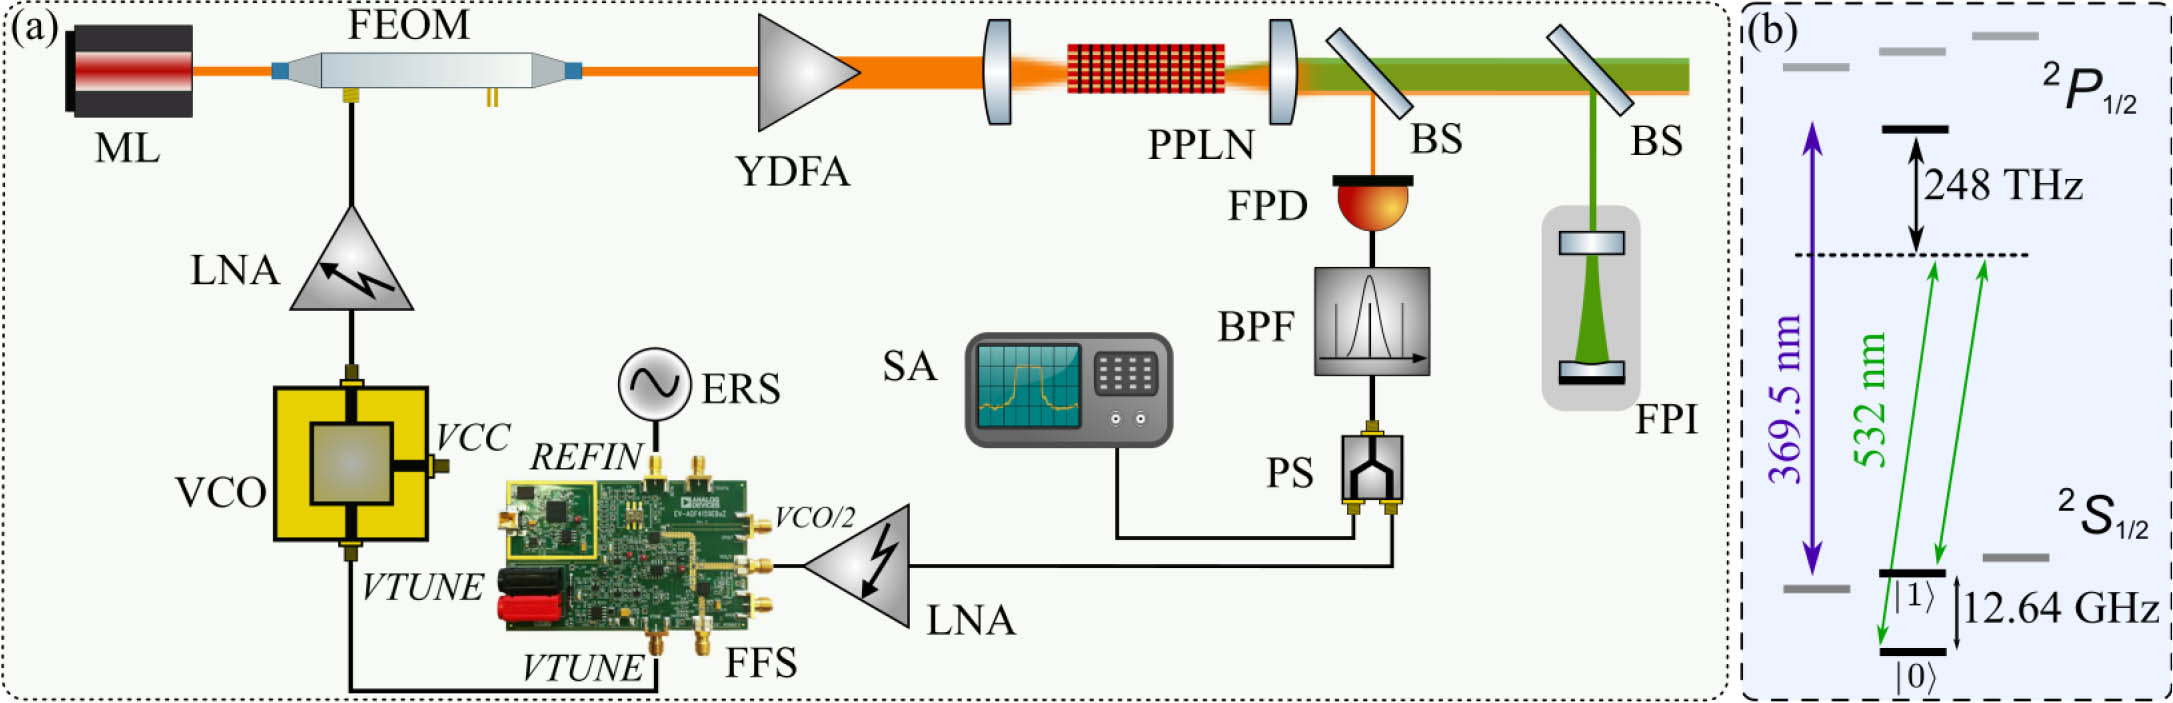
    Fig. 1. (a) Schematic of the experimental setup. Some concerned ports of the FFS chip and the VCO chip are marked by italics in the figure. (b) Energy level schematic of the 171Yb+ qubits. The energy levels associated with the stimulated Raman transition (SRT). Here, we utilize two 532 nm optical fields with a frequency difference of 12.64 GHz to implement the SRT. The transition wavelength for Doppler cooling is 369.5 nm. ML, monochromatic laser; FEOM, fiber electro-optic modulator; YDFA, ytterbium-doped fiber amplifier; BS, beam splitter; PPLN, periodically polarized lithium niobate; LNA, low-noise amplifier; FPD, fast photoelectric detector; VCO, voltage-controlled oscillator; ERS, external reference signal; PS, power splitter; SA, spectrum analyzer; FFS, fractional-N frequency synthesizer; FPI, Fabry–Pérot interferometer.
    (a) Comparison between the spectrum of the BNS when the system is free running and the loop is closed. The frequency span is set to 100 kHz, and the RBW and the VBW are both set to 10 Hz. (b) Expanded view of the BNS when the loop is closed. The frequency span is set to 100 Hz. The RBW is set to 1 Hz, and the VBW is set to 10 Hz.
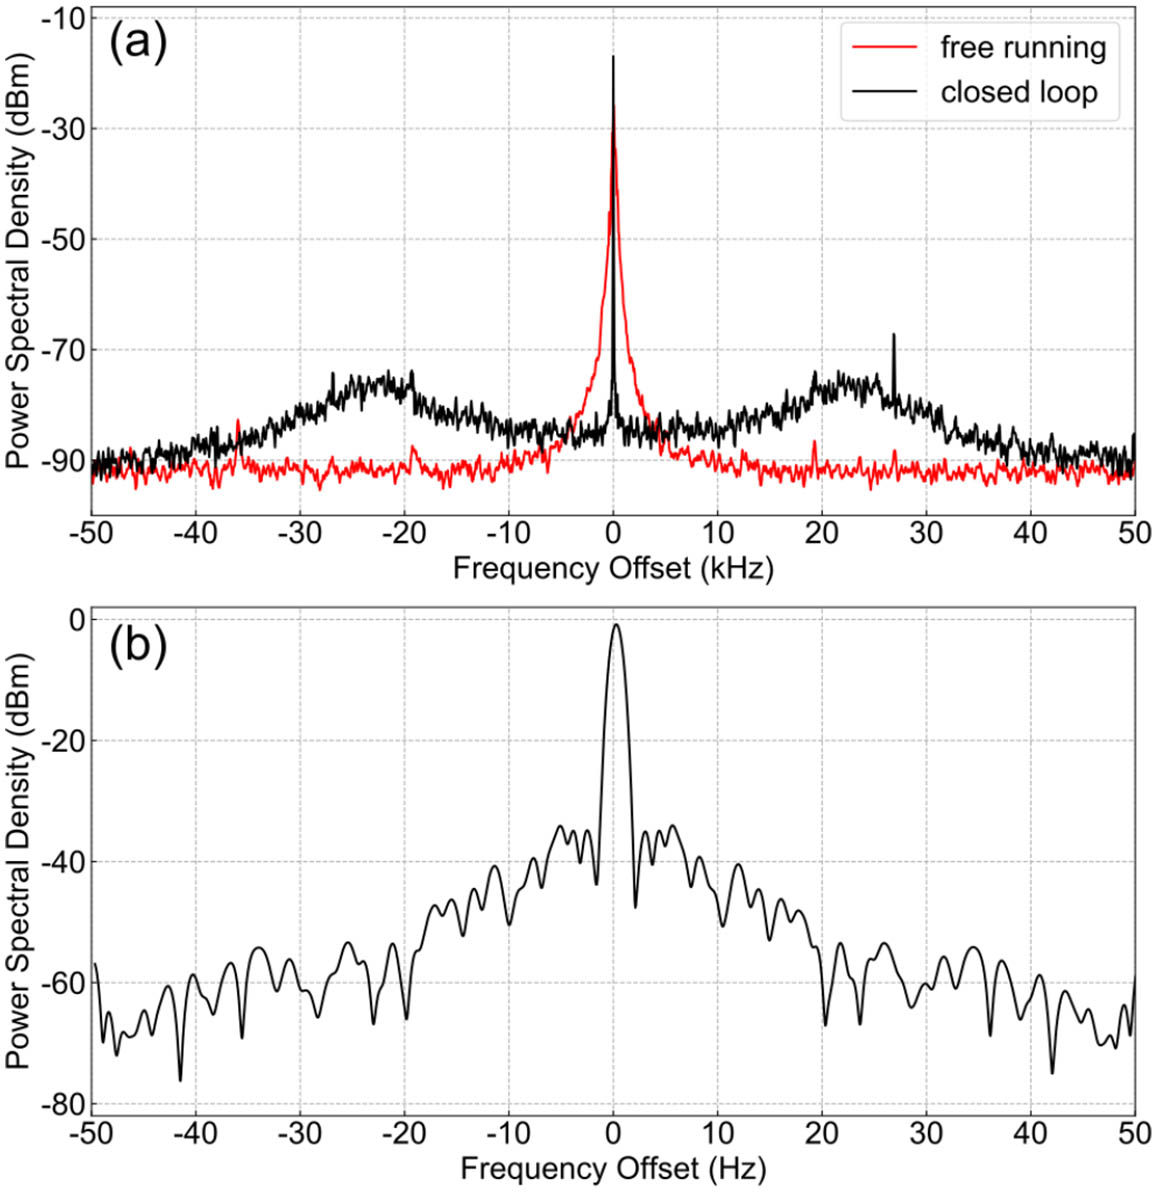
    Fig. 2. (a) Comparison between the spectrum of the BNS when the system is free running and the loop is closed. The frequency span is set to 100 kHz, and the RBW and the VBW are both set to 10 Hz. (b) Expanded view of the BNS when the loop is closed. The frequency span is set to 100 Hz. The RBW is set to 1 Hz, and the VBW is set to 10 Hz.
    Phase noise comparison between our scheme (when the loop is closed) and the scheme when the FEOM is directly driven by a commercial signal generator. The phase noise is measured by a phase noise analyzer rather than an SA.
    Fig. 3. Phase noise comparison between our scheme (when the loop is closed) and the scheme when the FEOM is directly driven by a commercial signal generator. The phase noise is measured by a phase noise analyzer rather than an SA.
    Dynamic performance of the PLL system. The locking frequency changes at the time t = 0. The voltage change of the VTUNE port with time is recorded by an oscilloscope. The rising time and the re-locking time are about 20 µs and 150 µs, respectively, according to the measured result.
    Fig. 4. Dynamic performance of the PLL system. The locking frequency changes at the time t = 0. The voltage change of the VTUNE port with time is recorded by an oscilloscope. The rising time and the re-locking time are about 20 µs and 150 µs, respectively, according to the measured result.
    Sideband spectra of the 532-nm laser measured with an FPI. When the driving frequency of the FEOM changes, the sidebands appear at the corresponding positions.
    Fig. 5. Sideband spectra of the 532-nm laser measured with an FPI. When the driving frequency of the FEOM changes, the sidebands appear at the corresponding positions.
    Rui-Rui Li, Wei-Ran Ye, Yi-Long Chen, Shu-Qian Chen, Wen-Hao Qi, Jin-Ming Cui, Yun-Feng Huang, Chuan-Feng Li, Guang-Can Guo. Generation of visible Raman operation laser by a fiber electro-optical modulator feedback loop[J]. Chinese Optics Letters, 2024, 22(2): 022702
    Download Citation