• Photonics Research
  • Vol. 8, Issue 4, 534 (2020)
Yu Zhang1, Siyu Lin1, Zhihai Liu1、2、4, Yaxun Zhang1、*, Jianzhong Zhang1, Jun Yang1, and Libo Yuan3
Author Affiliations
  • 1Key Laboratory of In-fiber Integrated Optics, Ministry of Education, Harbin Engineering University, Harbin 150001, China
  • 2National Demonstration Center for Experimental Physics Education, Harbin Engineering University, Harbin 150001, China
  • 3Photonics Research Center, Guilin University of Electronics Technology, Guilin 541004, China
  • 4e-mail: liuzhihai@hrbeu.edu.cn
  • show less
    DOI: 10.1364/PRJ.381397 Cite this Article Set citation alerts
    Yu Zhang, Siyu Lin, Zhihai Liu, Yaxun Zhang, Jianzhong Zhang, Jun Yang, Libo Yuan. Laser-induced rotary micromotor with high energy conversion efficiency[J]. Photonics Research, 2020, 8(4): 534 Copy Citation Text show less
    (a) Profile image of the ACF; (b) image of the ACF probe made of a section of ACF and a GMS; (c) schematic diagram of heating and tapering the SMF and ACF.
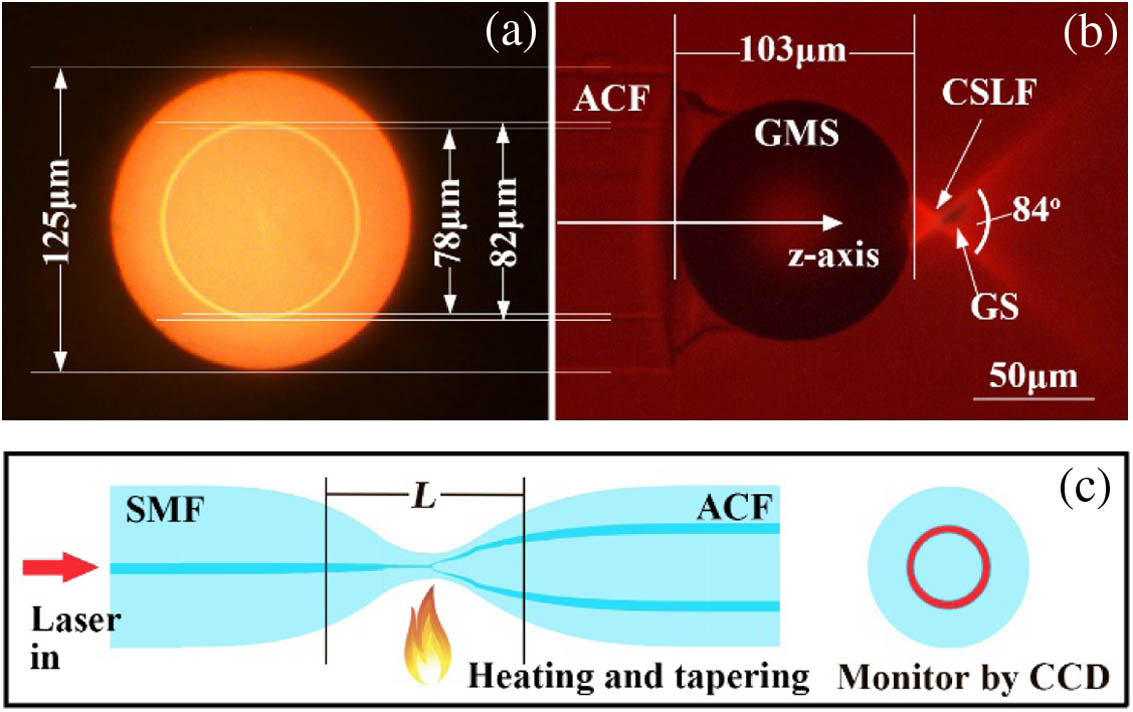
    Fig. 1. (a) Profile image of the ACF; (b) image of the ACF probe made of a section of ACF and a GMS; (c) schematic diagram of heating and tapering the SMF and ACF.
    (a) Schematic diagram of the CSLF introduced by the ACF probe. (b) Schematic diagram of the thermal field introduced by the CSLF. The z axis is the fiber probe main axis. (c) Schematic diagram of the GS trapped by the light-induced thermal field. The long axis of the GS is along the sidewall of the CSLF. (d) Schematic diagram of the net force exerted on the GS.
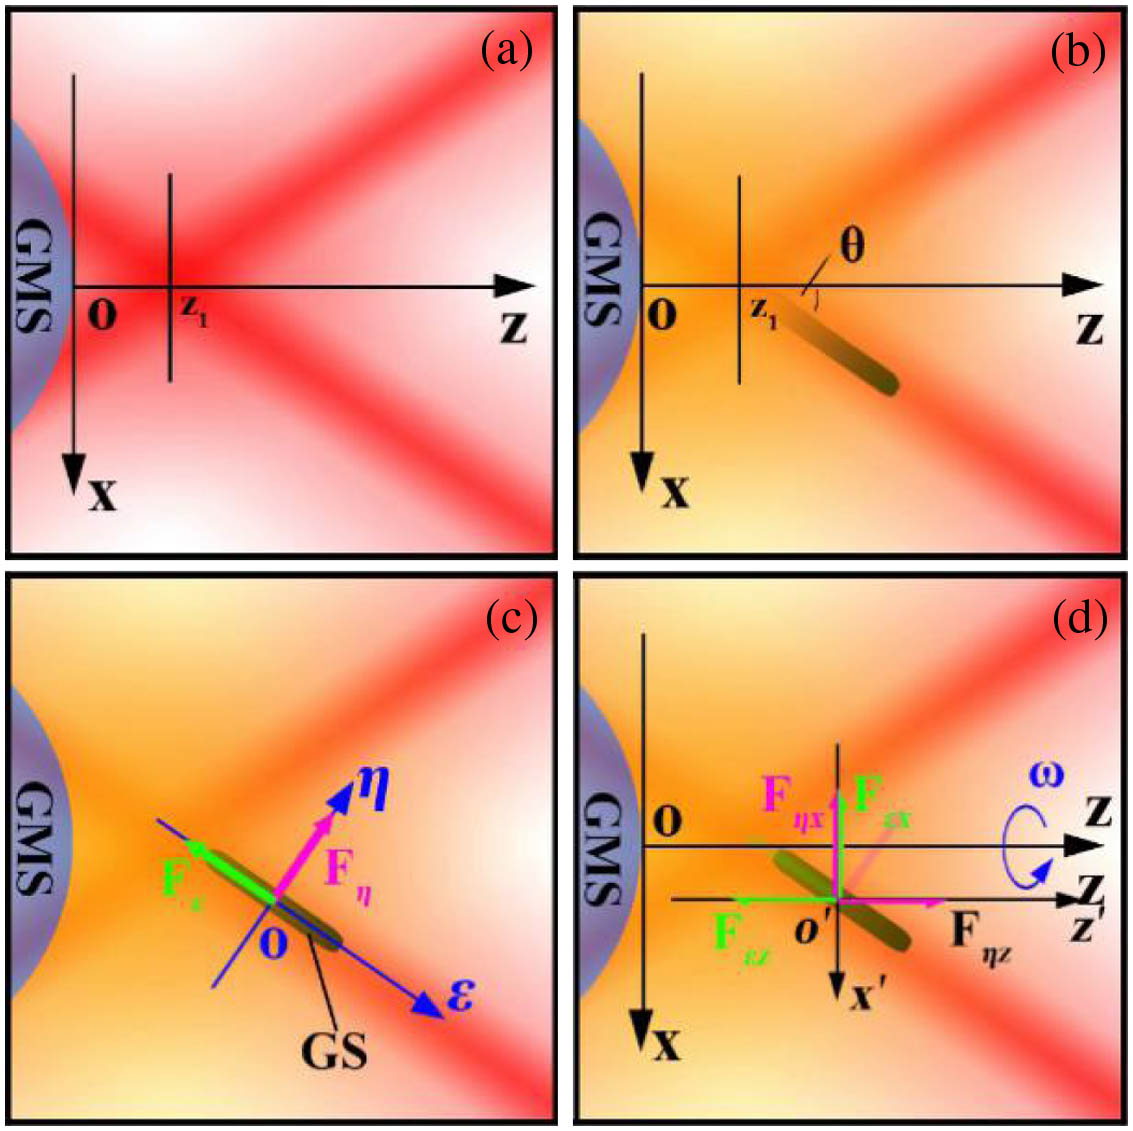
    Fig. 2. (a) Schematic diagram of the CSLF introduced by the ACF probe. (b) Schematic diagram of the thermal field introduced by the CSLF. The z axis is the fiber probe main axis. (c) Schematic diagram of the GS trapped by the light-induced thermal field. The long axis of the GS is along the sidewall of the CSLF. (d) Schematic diagram of the net force exerted on the GS.
    (a) Simulated results of the light field distribution near the fiber probe; the diameter of the focus spot is 2.6 μm; (b) simulated results of the thermal field distribution near the fiber probe; (c) the schematic diagram shows the calculation of the photophoretic force along the ε axis; (d) the schematic diagram shows the calculation of the photophoretic force along the ζ axis.
    Fig. 3. (a) Simulated results of the light field distribution near the fiber probe; the diameter of the focus spot is 2.6 μm; (b) simulated results of the thermal field distribution near the fiber probe; (c) the schematic diagram shows the calculation of the photophoretic force along the ε axis; (d) the schematic diagram shows the calculation of the photophoretic force along the ζ axis.
    Relationship between the rotation rate of the GS and the incident laser power with the ACF1 and ACF2 probes. Here E.R. means the experimental results and F.R. means the fitting results.
    Fig. 4. Relationship between the rotation rate of the GS and the incident laser power with the ACF1 and ACF2 probes. Here E.R. means the experimental results and F.R. means the fitting results.
    (a) Image of the ACF1 probe; (b) image of the ACF1 probe with some parameters; (c) image of the ACF1 probe performing the rotation of a piece of GS; (d) image of the ACF2 probe; (e) image of the ACF2 probe with some parameters; (f) image of the ACF2 probe performing the rotation of a piece of GS.
    Fig. 5. (a) Image of the ACF1 probe; (b) image of the ACF1 probe with some parameters; (c) image of the ACF1 probe performing the rotation of a piece of GS; (d) image of the ACF2 probe; (e) image of the ACF2 probe with some parameters; (f) image of the ACF2 probe performing the rotation of a piece of GS.
    Yu Zhang, Siyu Lin, Zhihai Liu, Yaxun Zhang, Jianzhong Zhang, Jun Yang, Libo Yuan. Laser-induced rotary micromotor with high energy conversion efficiency[J]. Photonics Research, 2020, 8(4): 534
    Download Citation