• Photonics Research
  • Vol. 9, Issue 3, 379 (2021)
Can Li1, Jinjuan Gao1、2, Muhammad Shafi1, Runcheng Liu1, Zhipeng Zha1, Dejun Feng3, Mei Liu1, Xuejian Du1, Weiwei Yue1、2、4、5、*, and Shouzhen Jiang1、2、6、*
Author Affiliations
  • 1Collaborative Innovation Center of Light Manipulations and Applications in Universities of Shandong School of Physics and Electronics, Shandong Normal University, Jinan 250014, China
  • 2Shandong Key Laboratory of Medical Physics and Image Processing & Shandong Provincial Engineering and Technical Center of Light Manipulations, Jinan 250014, China
  • 3School of Information Science and Engineering, Shandong University, Qingdao 266237, China
  • 4Shandong Key Laboratory of Biophysics, Institute of Biophysics, Dezhou University, Dezhou 253023, China
  • 5e-mail: yuewei@sdnu.edu.cn
  • 6e-mail: jiang_sz@126.com
  • show less
    DOI: 10.1364/PRJ.416815 Cite this Article Set citation alerts
    Can Li, Jinjuan Gao, Muhammad Shafi, Runcheng Liu, Zhipeng Zha, Dejun Feng, Mei Liu, Xuejian Du, Weiwei Yue, Shouzhen Jiang. Optical fiber SPR biosensor complying with a 3D composite hyperbolic metamaterial and a graphene film[J]. Photonics Research, 2021, 9(3): 379 Copy Citation Text show less
    Preparation process of G/HMM/D-POF.
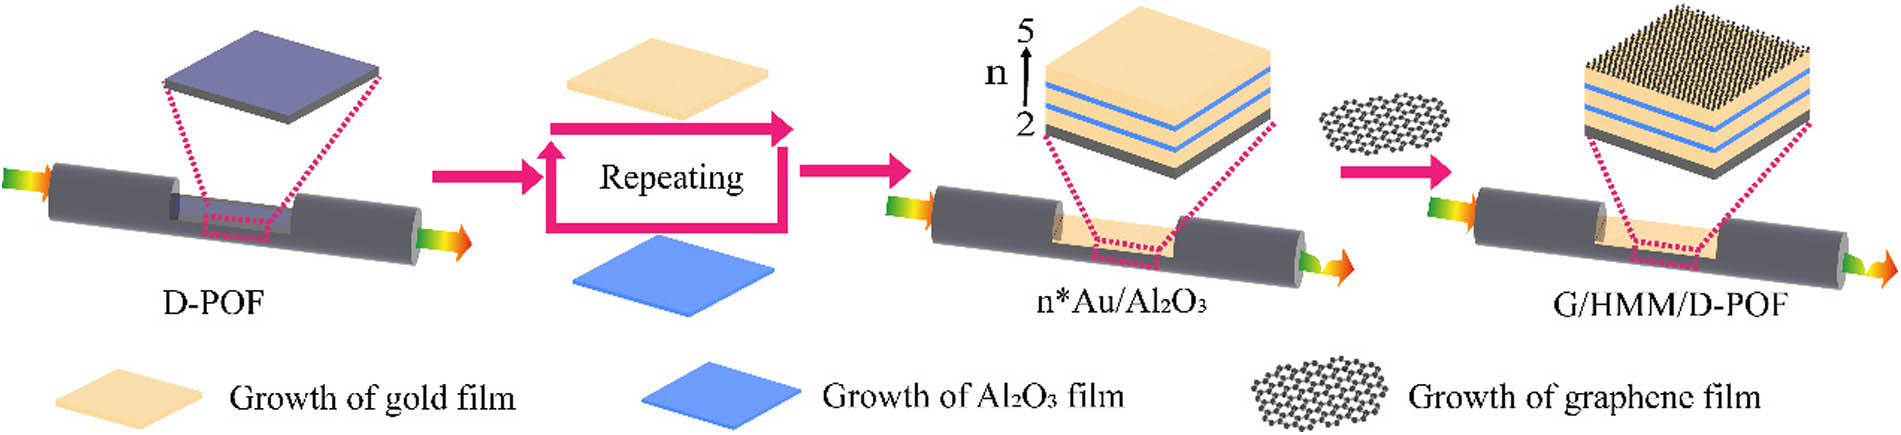
    Fig. 1. Preparation process of G/HMM/D-POF.
    Schematic of an experimental setup based on the G/HMM/D-POF sensor.
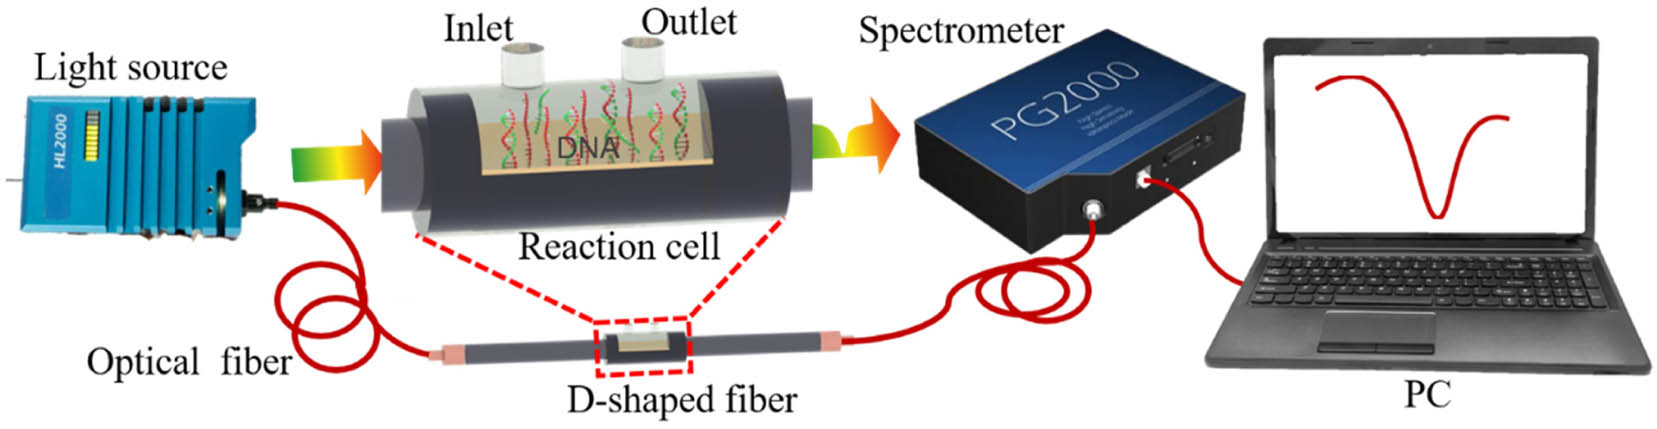
    Fig. 2. Schematic of an experimental setup based on the G/HMM/D-POF sensor.
    Simulation results. (a) Real and imaginary parts of the in-plane εx and out-of-plane εz permittivity components for an n*Au/Al2O3 structure with n=3. (b) Critical wavelength for n*Au/Al2O3 structures as a function of n value. (c) Simulation setup of the structure n*Au/Al2O3 (n=2–5). (d) Normalized transmission spectra of Au/D-POF and n*Au/Al2O3 (n=2–5) for RI increasing from 1.340 to 1.352, respectively. (e) SPR peak wavelengths at the RI of 1.340 and their redshifts at RIs varying from 1.340 to 1.352 for Au/D-POF and n*Au/Al2O3 (n=2–5). (f) Electric field distributions within Au/D-POF and n*Au/Al2O3 (n=2–5) structures at the resonance wavelengths for the RI of 1.340. (g) NormE values for Au/D-POF and n*Au/Al2O3 (n=2–5).
    Fig. 3. Simulation results. (a) Real and imaginary parts of the in-plane εx and out-of-plane εz permittivity components for an n*Au/Al2O3 structure with n=3. (b) Critical wavelength for n*Au/Al2O3 structures as a function of n value. (c) Simulation setup of the structure n*Au/Al2O3 (n=25). (d) Normalized transmission spectra of Au/D-POF and n*Au/Al2O3 (n=25) for RI increasing from 1.340 to 1.352, respectively. (e) SPR peak wavelengths at the RI of 1.340 and their redshifts at RIs varying from 1.340 to 1.352 for Au/D-POF and n*Au/Al2O3 (n=25). (f) Electric field distributions within Au/D-POF and n*Au/Al2O3 (n=25) structures at the resonance wavelengths for the RI of 1.340. (g) NormE values for Au/D-POF and n*Au/Al2O3 (n=25).
    (a) Optical graph of Au/D-POF and n*Au/Al2O3 (n=2–5). (b) Top SEM image of 3*Au/Al2O3. (c) SEM cross-sectional image of a 50-nm-thick gold structure. (d) SEM cross-sectional image of 3*Au/Al2O3. (e) EDS spectra of 3*Au/Al2O3. (f)–(h) EDS element distribution maps from (f) Al, (g) O, (h) Au on 3*Au/Al2O3.
    Fig. 4. (a) Optical graph of Au/D-POF and n*Au/Al2O3 (n=25). (b) Top SEM image of 3*Au/Al2O3. (c) SEM cross-sectional image of a 50-nm-thick gold structure. (d) SEM cross-sectional image of 3*Au/Al2O3. (e) EDS spectra of 3*Au/Al2O3. (f)–(h) EDS element distribution maps from (f) Al, (g) O, (h) Au on 3*Au/Al2O3.
    (a)–(e) Normalized transmission spectra of Au/D-POF and n*Au/Al2O3 (n=2–5) in the ethanol solution with RIs ranging from 1.340 to 1.352, respectively. (f) SPR peak wavelengths for Au/D-POF and n*Au/Al2O3 (n=2–5) in the ethanol solution at the RI (1.340) and the redshifts caused by increasing RI (from 1.340 to 1.352).
    Fig. 5. (a)–(e) Normalized transmission spectra of Au/D-POF and n*Au/Al2O3 (n=25) in the ethanol solution with RIs ranging from 1.340 to 1.352, respectively. (f) SPR peak wavelengths for Au/D-POF and n*Au/Al2O3 (n=25) in the ethanol solution at the RI (1.340) and the redshifts caused by increasing RI (from 1.340 to 1.352).
    (a) Front SEM image of G/HMM/D-POF in the sensing area. (b) Raman spectra of graphene oxide and chemically produced graphene. The inset shows the 2905 cm−1 peak position distribution within a scanned area of 20 μm×20 μm. (c) Normalized transmission spectra of G/HMM/D-POF in the ethanol solutions with RIs from 1.340 to 1.352. (d) Resonance wavelength redshift of G/HMM/D-POF as a function of RI. (e) Normalized transmission spectra of G/HMM/D-POF at the RI of 1.352, recorded in a cycling mode (up to 10 cycles). (f) Typical response-recovery characteristic curve of G/HMM/D-POF in ethanol solution (RI of 1.352) at a resonance wavelength of 648 nm.
    Fig. 6. (a) Front SEM image of G/HMM/D-POF in the sensing area. (b) Raman spectra of graphene oxide and chemically produced graphene. The inset shows the 2905  cm1 peak position distribution within a scanned area of 20μm×20  μm. (c) Normalized transmission spectra of G/HMM/D-POF in the ethanol solutions with RIs from 1.340 to 1.352. (d) Resonance wavelength redshift of G/HMM/D-POF as a function of RI. (e) Normalized transmission spectra of G/HMM/D-POF at the RI of 1.352, recorded in a cycling mode (up to 10 cycles). (f) Typical response-recovery characteristic curve of G/HMM/D-POF in ethanol solution (RI of 1.352) at a resonance wavelength of 648 nm.
    (a) Normalized transmission spectra of the G/HMM/D-POF sensor during DNA modification. (b) Normalized transmission spectra of G/HMM/D-POF in t_DNA solutions with concentrations varying from 10 pM to 100 nM after being sufficiently complementary. (c) Redshift and SPR peak wavelength versus t_DNA concentration.
    Fig. 7. (a) Normalized transmission spectra of the G/HMM/D-POF sensor during DNA modification. (b) Normalized transmission spectra of G/HMM/D-POF in t_DNA solutions with concentrations varying from 10 pM to 100 nM after being sufficiently complementary. (c) Redshift and SPR peak wavelength versus t_DNA concentration.
    (a) Normalized transmission spectra before and after adding mis_DNA. (b) Timing detection curve for t_DNA solutions with concentrations from 10 pM to 100 nM. (c) Normalized transmission spectra of G/HMM/D-POF in the 0.1 nM t_DNA solution during the binding process. (d) Normalized transmission spectra of G/HMM/D-POF in the 0.1 nM t_DNA solution during the dissociation. (e) Real-time redshift for the binding process and dissociation in the 0.1 nM t_DNA solution. (f) Real-time SPR wavelength shift for G/HMM/D-POF in mis_DNA and t_DNA solutions with concentrations from 10 pM to 100 nM.
    Fig. 8. (a) Normalized transmission spectra before and after adding mis_DNA. (b) Timing detection curve for t_DNA solutions with concentrations from 10 pM to 100 nM. (c) Normalized transmission spectra of G/HMM/D-POF in the 0.1 nM t_DNA solution during the binding process. (d) Normalized transmission spectra of G/HMM/D-POF in the 0.1 nM t_DNA solution during the dissociation. (e) Real-time redshift for the binding process and dissociation in the 0.1 nM t_DNA solution. (f) Real-time SPR wavelength shift for G/HMM/D-POF in mis_DNA and t_DNA solutions with concentrations from 10 pM to 100 nM.
    TypeSequences (15-mers)
    Probe aptamer5-TGT ACA TCA CAA CTA-3
    Target DNA5-TAG TTG TGA TGT ACA-3
    Mis_DNA5-CCT CCA CAG CTC GAG-3
    Table 1. DNA Applied in This Study
    Can Li, Jinjuan Gao, Muhammad Shafi, Runcheng Liu, Zhipeng Zha, Dejun Feng, Mei Liu, Xuejian Du, Weiwei Yue, Shouzhen Jiang. Optical fiber SPR biosensor complying with a 3D composite hyperbolic metamaterial and a graphene film[J]. Photonics Research, 2021, 9(3): 379
    Download Citation