
Zhixu Jia, Chuanfei Yao, Shijie Jia, Shunbin Wang, Zhenrui Li, Zhipeng Zhao, Weiping Qin, Guanshi Qin. Progress on Novel Mid-Infrared Glass Fibers and Relative Lasers[J]. Laser & Optoelectronics Progress, 2019, 56(17): 170604
- Laser & Optoelectronics Progress
- Vol. 56, Issue 17, 170604 (2019)
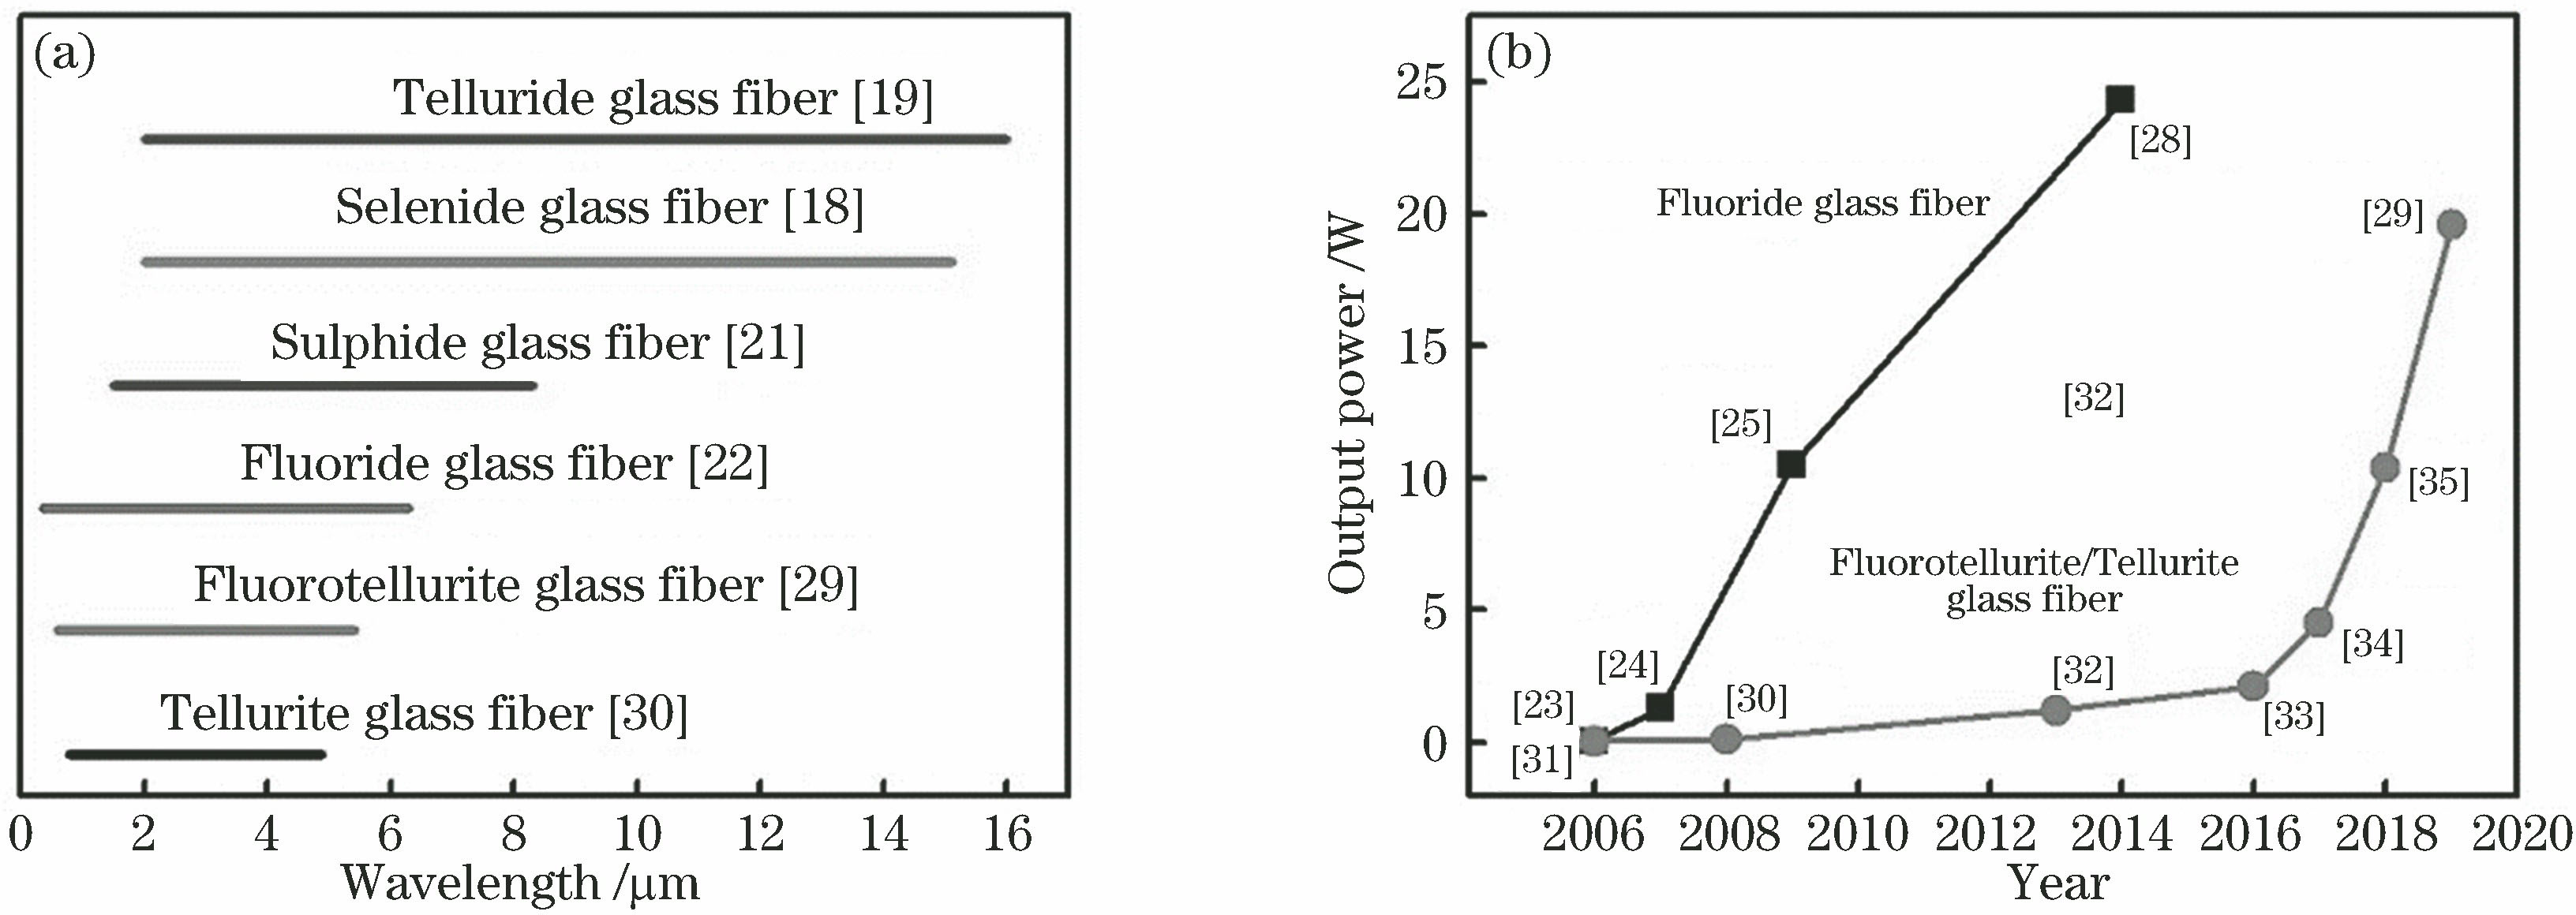
Fig. 1. Progress on the main parameters of mid-infrared SC fiber laser sources. (a) Spectral bandwidth; (b) output power scale
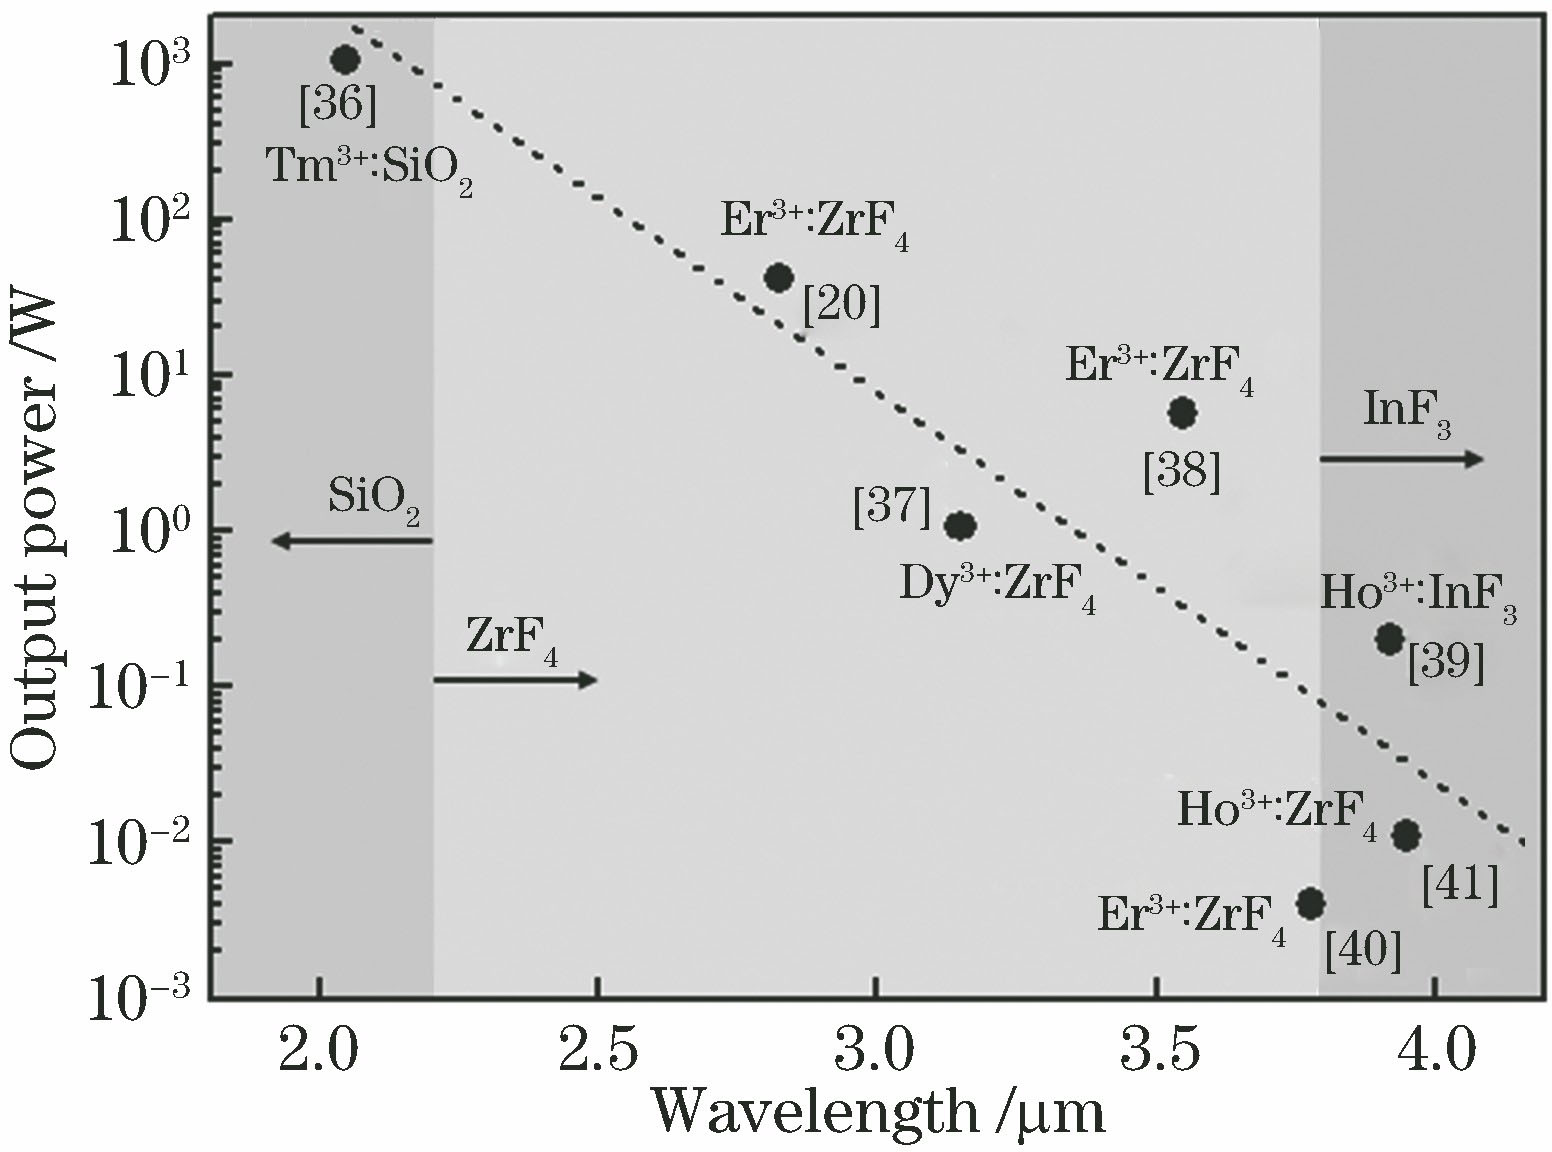
Fig. 2. Progress on the operational wavelength and output power scale of mid-infrared rare-earth-ions-doped fiber lasers
Fig. 3. DTA curves of TBY and ABCYSMT glasses
Fig. 4. Refractive indices of the glasses and NA of the relative fiber. (a) Refractive indices of TBY and ABCYSMT glasses; (b) dependence of NA of all-solid fluorotellurite fibers on the wavelength
Fig. 5. Parameters of the tapered fluorotellurite fiber. (a) Dependence of the core diameter of the tapered fluorotellurite fiber on the position of the fiber, inset is that scanning electron micrograph of the untapered fluorotellurite fiber; (b) GVD curves for fluorotellurite fibers with different core diameters
Fig. 6. Dependence of SC spectra from the tapered fluorotellurite fiber on the average pump power. From bottom to top, the average pump powers are 0.26, 0.42, 0.6, 0.79, 0.99, 1.2, 1.38 and 1.57 W, respectively
Fig. 7. SC spectrum from the all solid high-NA fluorotellurite fiber with an average pump power of about 32.8 W at about 2 μm wavelength
Fig. 8. Transmission spectrum of ABYPM glass
Fig. 9. Experimental results of ABYPM glass before and after dipping in water. (a) Infrared transmission spectra; (b) glass photos
Fig. 10. DTA curves of ABYPM and ABYPMC glasses
Fig. 11. Raman spectra of ABYPM and ABYPMC glasses
Fig. 12. Refractive indices of ABYPM and ABYPMC glasses, and the dependence of NA of AlF3 based glass fibers on the wavelength
Fig. 13. Scanning electron micrograph of Ho3+-doped AlF3 based glass fiber end
Fig. 14. Absorption and emission cross-sections of the transitions of Ho3+ in the ABYPM glass. (a) Absorption cross-section of the transition 5I8-5I6; (b) absorption and emission cross-sections of the transition 5I7-5I6
Fig. 15. Diagram of the experimental setup for 2868 nm fiber laser
Fig. 16. Performances of 2868 nm laser based on the Ho3+∶AlF3 fiber. (a) Spectrum of the 2868 nm laser with the launched pump power of 1224 mW; (b) output power of 2868 nm laser as a function of the launched pump power
Fig. 17. Dependence of slope efficiency and threshold pump power of 2868 nm fiber laser on the fiber length
Fig. 18. Transmission spectra of IZGP and IZGN glasses. Inset is that loss spectrum of the bulk IZGP glass
Fig. 19. Raman spectra of IZGP and IZGN glasses
Fig. 20. DTA curves of IZGP and IZGN glasses
Fig. 21. Scanning electron micrograph. (a) Scanning electron micrograph of Ho3+-doped InF3 based glass fiber end; (b) enlarged cross-section in the dashed line area of fiber end
Fig. 22. Absorption and emission cross-sections of Ho3+-doped in the IZGP glass. (a) Transition 5I6-5I8; (b) transition 5I6-5I7
Fig. 23. Performances of 2875 nm laser based on the Ho3+∶InF3 fiber. (a) Output spectrum of the 2875 nm laser for a launched pump power of 1224 mW at 1120 nm; (b) output power of the 2875 nm laser as a function of the launched pump power
Fig. 24. Dependence of slope efficiency and threshold pump power of 2875 nm fiber laser on the fiber length
Fig. 25. Performances of 3.92 μm laser based on the Ho3+∶InF3 fiber. (a) Spectra of the Ho3+∶InF3 fiber laser for different output powers; (b) output power of the 3.92 μm fiber laser as a function of the launched pump power

Set citation alerts for the article
Please enter your email address
© Copyright 2018-2021 | Chinese Laser Press. All Rights Reserved 沪ICP备15018463号-20