• Photonics Research
  • Vol. 5, Issue 2, A13 (2017)
Benjamin D. Mangum, Tiemo S. Landes, Brian R. Theobald, and Juanita N. Kurtin*
Author Affiliations
  • Pacific Light Technologies, 2828 SW Corbett Ave., Portland, Oregon 97201, USA
  • show less
    DOI: 10.1364/PRJ.5.000A13 Cite this Article Set citation alerts
    Benjamin D. Mangum, Tiemo S. Landes, Brian R. Theobald, Juanita N. Kurtin. Exploring the bounds of narrow-band quantum dot downconverted LEDs[J]. Photonics Research, 2017, 5(2): A13 Copy Citation Text show less
    QD absorption and emission spectra for an ensemble of QDs diluted in cyclohexane. These QDs have been engineered to minimize self-absorption, i.e., emission and absorption spectra have minimal overlap. Note that the peak emission has been normalized to the absorption at 450 nm.
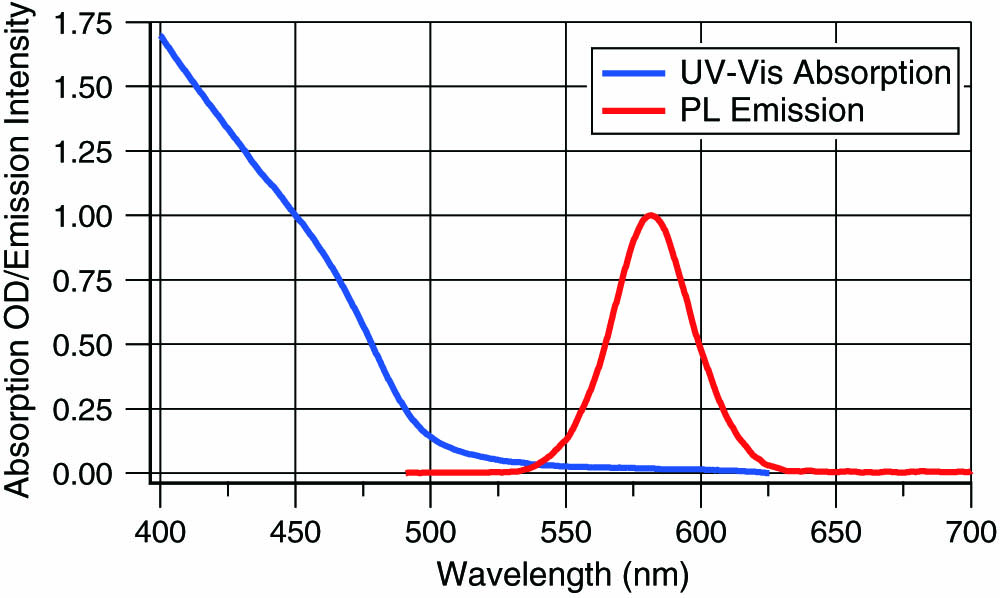
    Fig. 1. QD absorption and emission spectra for an ensemble of QDs diluted in cyclohexane. These QDs have been engineered to minimize self-absorption, i.e., emission and absorption spectra have minimal overlap. Note that the peak emission has been normalized to the absorption at 450 nm.
    Data obtained from Lumileds showing the high temperature operating lifetime (HTOL) of white QD-converted LEDs. LED lighting packages (3535) are aged at a drive current of 200 mA at 95°C. The color maintenance specification set by the DOE Energy Star program is identified with a dashed line.
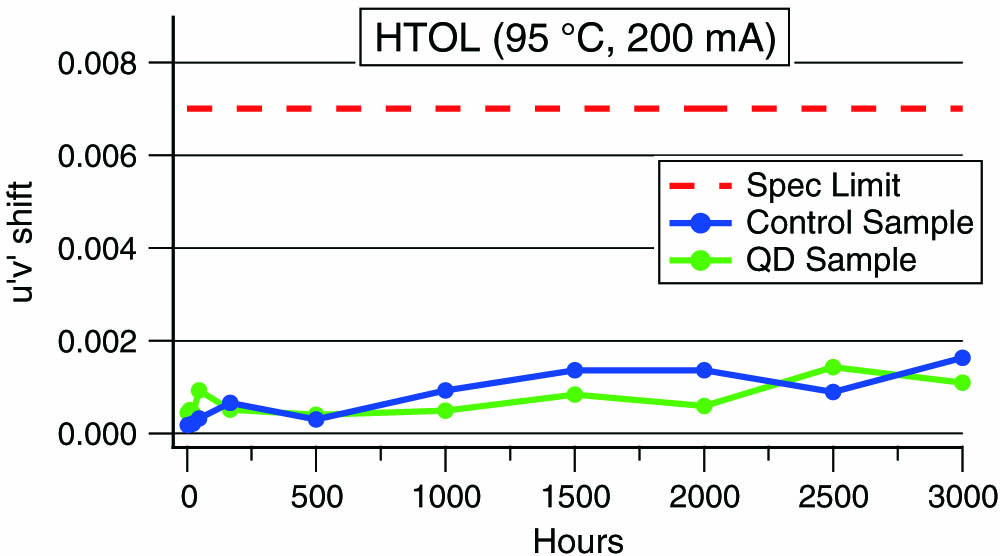
    Fig. 2. Data obtained from Lumileds showing the high temperature operating lifetime (HTOL) of white QD-converted LEDs. LED lighting packages (3535) are aged at a drive current of 200 mA at 95°C. The color maintenance specification set by the DOE Energy Star program is identified with a dashed line.
    Single-particle optical characteristics compared to ensemble. Top Graph: ensemble absorption HWHM of the first exciton peak for CdSe cores. Experimental batches represent attempts to achieve a narrower size distribution of QD cores. Middle Graph: FWHM comparison; single particles (solid bars) range from 7 to 15 nm narrower than ensemble (dashed bars). Bottom Graph: centroid comparison; single particles (solid bars) are typically within a few nm of ensemble measurements in solution (dashed bars), though there exist samples with large discrepancies.
    Fig. 3. Single-particle optical characteristics compared to ensemble. Top Graph: ensemble absorption HWHM of the first exciton peak for CdSe cores. Experimental batches represent attempts to achieve a narrower size distribution of QD cores. Middle Graph: FWHM comparison; single particles (solid bars) range from 7 to 15 nm narrower than ensemble (dashed bars). Bottom Graph: centroid comparison; single particles (solid bars) are typically within a few nm of ensemble measurements in solution (dashed bars), though there exist samples with large discrepancies.
    Confirmed single-QD measurements from Production Batch 1 (n=48). Top Graph: overlaid spectra showing wide range of center wavelengths and intensities. Middle Left: FWHM versus centroid; the linear fit indicates little to no relationship. Middle Right: histogram of FWHM measurements. Bottom Left: lifetime versus FWHM; the linear fit shows a strong correlation. Bottom Right: histogram of lifetime measurements.
    Fig. 4. Confirmed single-QD measurements from Production Batch 1 (n=48). Top Graph: overlaid spectra showing wide range of center wavelengths and intensities. Middle Left: FWHM versus centroid; the linear fit indicates little to no relationship. Middle Right: histogram of FWHM measurements. Bottom Left: lifetime versus FWHM; the linear fit shows a strong correlation. Bottom Right: histogram of lifetime measurements.
    Confirmed single-QD measurements from Experimental Batch 2 (n=40). Top Graph: overlaid spectra showing wide range of center wavelengths and intensities. Middle Left: FWHM versus centroid; the linear fit indicates a strong relationship between the two. The range of FWHM values is greater than the Production Batch. Middle Right: histogram of FWHM measurements. Bottom Left: lifetime versus FWHM; the linear fit shows a strong correlation. Bottom Right: histogram of lifetime measurements.
    Fig. 5. Confirmed single-QD measurements from Experimental Batch 2 (n=40). Top Graph: overlaid spectra showing wide range of center wavelengths and intensities. Middle Left: FWHM versus centroid; the linear fit indicates a strong relationship between the two. The range of FWHM values is greater than the Production Batch. Middle Right: histogram of FWHM measurements. Bottom Left: lifetime versus FWHM; the linear fit shows a strong correlation. Bottom Right: histogram of lifetime measurements.
    Top: Several modeled spectra are shown. Red curve: FWHM=63 nm, red peak λ=643.4, QE=1.0, LER=298. Green curve: FWHM=35.5 nm, red peak λ=627, QE=0.75, LER=338. Purple curve: FWHM=15.5 nm, red peak λ=624.2, QE=0.5, LER=349. Bottom: LER versus FWHM results of filtered data set from modeling based on 3000 K device. The parameters and ranges of the model are found in Table 1. The data are filtered according to Table 2. The QE of the QDs is represented by the color scale. Points have been layered such that the minimum QE to attain a given LER is on top.
    Fig. 6. Top: Several modeled spectra are shown. Red curve: FWHM=63  nm, red peak λ=643.4, QE=1.0, LER=298. Green curve: FWHM=35.5  nm, red peak λ=627, QE=0.75, LER=338. Purple curve: FWHM=15.5  nm, red peak λ=624.2, QE=0.5, LER=349. Bottom: LER versus FWHM results of filtered data set from modeling based on 3000 K device. The parameters and ranges of the model are found in Table 1. The data are filtered according to Table 2. The QE of the QDs is represented by the color scale. Points have been layered such that the minimum QE to attain a given LER is on top.
    LER versus FWHM results of filtered data set from modeling based on 4000 K device. The parameters and ranges of the model are found in Table 1. The data are filtered according to Table 2. The QE of the QDs is represented by the color scale. Points have been layered such that the minimum QE to attain a given LER is on top.
    Fig. 7. LER versus FWHM results of filtered data set from modeling based on 4000 K device. The parameters and ranges of the model are found in Table 1. The data are filtered according to Table 2. The QE of the QDs is represented by the color scale. Points have been layered such that the minimum QE to attain a given LER is on top.
    LER versus QD peak wavelength from filtered data set from modeling based on 3000 K device. The parameters and ranges of the model are found in Table 1. The data are filtered according to Table 2.
    Fig. 8. LER versus QD peak wavelength from filtered data set from modeling based on 3000 K device. The parameters and ranges of the model are found in Table 1. The data are filtered according to Table 2.
    Top: BLU spectrum comprised of green and red Cd-based QDs. While this spectra is representative of the FWHM values, further color tuning of the peak emission can result in much better gamut coverage. The CF72 color filters are also shown. Bottom: Modeling results showing the impact of FWHM on Rec. 2020 coverage as calculated in CIE 1931 color space. This plot includes all wavelength and loading combinations, but has been filtered such that the maximum achievable gamut for any FWHM point is layered on top. The color bar indicates the fraction of Rec. 2020 coverage. A black datum representing literature reports for InP QDs has been included for comparison.
    Fig. 9. Top: BLU spectrum comprised of green and red Cd-based QDs. While this spectra is representative of the FWHM values, further color tuning of the peak emission can result in much better gamut coverage. The CF72 color filters are also shown. Bottom: Modeling results showing the impact of FWHM on Rec. 2020 coverage as calculated in CIE 1931 color space. This plot includes all wavelength and loading combinations, but has been filtered such that the maximum achievable gamut for any FWHM point is layered on top. The color bar indicates the fraction of Rec. 2020 coverage. A black datum representing literature reports for InP QDs has been included for comparison.
    Modeling results for Rec. 2020 coverage. The Rec. 2020 gamut is defined by the black dashed line. The D65 white point and Planckian locus are identified as well. The gamut attainable via use of Cd-based QDs is specified by the purple triangle while that of a leading InP QD system is shown as an orange triangle. As is conventionally done, these are measured/calculated at room temperature. The Cd-based QD has coverage of 80.8% Rec. 2020, while the InP-based QD has coverage of 66.7%.
    Fig. 10. Modeling results for Rec. 2020 coverage. The Rec. 2020 gamut is defined by the black dashed line. The D65 white point and Planckian locus are identified as well. The gamut attainable via use of Cd-based QDs is specified by the purple triangle while that of a leading InP QD system is shown as an orange triangle. As is conventionally done, these are measured/calculated at room temperature. The Cd-based QD has coverage of 80.8% Rec. 2020, while the InP-based QD has coverage of 66.7%.
    ParameterRangeStep Size
    QD QE0.5–1.00.05
    QD Wavelength605–645 nm0.4 nm
    QD FWHM15–115 nm0.5 nm
    QD Loading0.5×1.5× of test device0.1
    Phosphor Loading0.5×1.5× of test device0.1
    Table 1. Ranges and Step Sizes for Parameters Used in Modeling QD-Based LED Spectra
    Metric3000 K Data Set4000 K Data Set
    CRICRI Ra>90CRI Ra>90
    R9R9>50R9>50
    CQSCQS Qa>87CQS Qa>87
    DuvWithin 0.003 (UV space)Within 0.003 (UV space)
    CCT2700 K <CCT<3100  K3800 K <CCT<4200  K
    Table 2. Color Metric Filters Applied to Modeled Spectra
    ParameterRangeStep Size
    Green Wavelength525–540 nm1.25 nm
    Green FWHM10–65 nm1.0 nm
    Green Loading0.75×1.25× of initial0.05
    Red Wavelength625–640 nm1.25 nm
    Red FWHM10–70 nm1.0 nm
    Red Loading0.75×1.25× of initial0.05
    Table 3. Ranges and Step Sizes for Parameters Used in Modeling QD Converted LED BLU Spectra
    Benjamin D. Mangum, Tiemo S. Landes, Brian R. Theobald, Juanita N. Kurtin. Exploring the bounds of narrow-band quantum dot downconverted LEDs[J]. Photonics Research, 2017, 5(2): A13
    Download Citation