• Photonics Research
  • Vol. 5, Issue 2, A13 (2017)
Benjamin D. Mangum, Tiemo S. Landes, Brian R. Theobald, and Juanita N. Kurtin*
Author Affiliations
  • Pacific Light Technologies, 2828 SW Corbett Ave., Portland, Oregon 97201, USA
  • show less
    DOI: 10.1364/PRJ.5.000A13 Cite this Article Set citation alerts
    Benjamin D. Mangum, Tiemo S. Landes, Brian R. Theobald, Juanita N. Kurtin. Exploring the bounds of narrow-band quantum dot downconverted LEDs[J]. Photonics Research, 2017, 5(2): A13 Copy Citation Text show less

    Abstract

    Quantum dots are finding increasing commercial success in LED applications. While they have been used for several years in remote off-chip architectures for display applications, it is shown for the first time to our knowledge that quantum dots can withstand the demands of the on-chip architecture and therefore are capable of being used as a direct phosphor replacement in both lighting and display applications. It is well known that, to achieve improved color metrics in lighting as well as increased gamut in display technologies, it is highly desirable to utilize a downconverter with a narrow emission linewidth as well as a precisely tunable peak. This paper will discuss the results of on-chip use of quantum dots in a lighting product, and explore the opportunities and practical limits for improvement of various lighting and display metrics by use of this unique downconverter technology.

    1. INTRODUCTION

    From the early days of quantum dot (QD) research, QDs have long been targeted for use as downconverters in LEDs due to their combination of unique emission characteristics: tunability of wavelength and narrow emission linewidths [1,2]. While other state-of-the-art downconverters may offer one of these traits, simultaneously achieving this combination of capabilities can only be realized by QDs. Both lighting and display applications can greatly benefit from narrow emitting downconverters. For many years the use of QDs has been a goal in lighting, primarily because QDs present the opportunity to have high efficiency and precisely tunable narrow bandwidth emission, especially in a wavelength range that provides significant technological difficulties for conventional phosphors [3]. While display technologies have seen the introduction of QD products, current product offerings are remote-phosphor configurations where the QD downconverters are not integrated with the LED package.

    Downconverters must generally be capable of being applied directly onto the LED chip to allow for a cost-effective device architecture without altering the small form factor achieved by the state-of-the-art LED solutions. Until now, this has presented a major problem for the use of QDs for two key reasons: stability at high temperatures and self-absorption due to a large overlap between absorption and emission by typical QD materials. These issues have been solved through a QD design that directly addresses the issue of stability and self-absorption without incurring any penalty to QD performance. Importantly, QDs are produced in a powder form, thereby addressing a more subtle but definitely not trivial issue of integrating QDs into the LED production process. Specifically, QD powders are added at a sufficiently high level to achieve a desired color point in a way that is compatible with optical grade silicones.

    The QDs in this study utilize an architecture that minimizes self-absorption across a range of visible wavelengths (Fig. 1), is compatible with the LED packaging process, and is stable in reliability testing under standard long-term stress conditions (Fig. 2). In collaboration with an LED manufacturing partner, Lumileds, QD-based LEDs have been developed and tested in the same manner as conventional phosphor-converted LEDs. While Lumileds has presented in this issue device-level results based on the use of QDs in their packages [4], this paper will focus on the ultimate capabilities of these materials.

    QD absorption and emission spectra for an ensemble of QDs diluted in cyclohexane. These QDs have been engineered to minimize self-absorption, i.e., emission and absorption spectra have minimal overlap. Note that the peak emission has been normalized to the absorption at 450 nm.

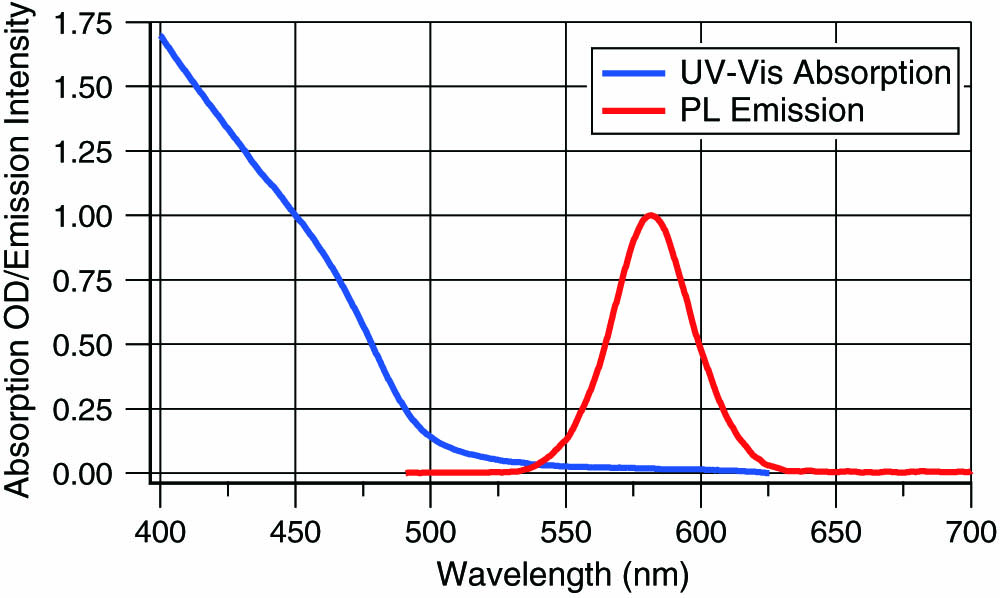
    Figure 1.QD absorption and emission spectra for an ensemble of QDs diluted in cyclohexane. These QDs have been engineered to minimize self-absorption, i.e., emission and absorption spectra have minimal overlap. Note that the peak emission has been normalized to the absorption at 450 nm.

    Data obtained from Lumileds showing the high temperature operating lifetime (HTOL) of white QD-converted LEDs. LED lighting packages (3535) are aged at a drive current of 200 mA at 95°C. The color maintenance specification set by the DOE Energy Star program is identified with a dashed line.

    Figure 2.Data obtained from Lumileds showing the high temperature operating lifetime (HTOL) of white QD-converted LEDs. LED lighting packages (3535) are aged at a drive current of 200 mA at 95°C. The color maintenance specification set by the DOE Energy Star program is identified with a dashed line.

    Like all narrow-emission, high-performance QDs, these QDs contain a small amount of cadmium. The amount of Cd used in the on-chip solution is significantly less than in a remote implementation. However, there is still a desire to evaluate cadmium-free QDs for on-chip use. The most well-developed Cd-free QD candidate technology currently is InP based [58]. To date, a survey of InP-based QDs shows that the full width at half maximum (FWHM) of the emission is in the range of 50 nm for green and 65 nm for red [58]. The following sections will demonstrate how the material properties of Cd-containing and Cd-free QDs affect the product performance pertaining to both lighting solid-state-lighting (SSL, color properties and efficacy) and display (LED LCD color gamut). Importantly, this is a theoretical comparison only; Cd-free QDs such as InP are notoriously air sensitive [9] and have not demonstrated sufficient stability to be used in on-chip applications.

    The use of Cd in electronic devices is regulated in the European Union (EU) under the Restriction of Hazardous Substances Directive, or RoHS, and many other countries implement the same regulation with the same limits and exemptions as the EU. The use of Cd is limited to 100 ppm in the smallest homogeneous component of the electronic device containing the metal, which in the case of on-chip LED usage is the downconversion layer composed of silicone, QDs, and other phosphors deposited inside the LED package. In this layer, the QD downconverters are much more concentrated than they would be in a remote optic; therefore, while the total amount of Cd used per LED is a few micrograms, the concentration is currently above 100 ppm for the on-chip QD materials presented here. The actual concentration of Cd depends on the package, color point, and other factors, but currently ranges between 150 and 500 ppm as measured by LED manufacturing partners using these QD materials, as well as by external labs. Currently there is an exemption in place (Exemption 39 of the RoHS Directive) which allows for the use of Cd above the 100 ppm limit in LED applications. The exemption is up for renewal and there is likely to be a revision to the language of the exemption in 2017.

    By focusing on on-chip solutions, the range of market opportunities for QDs is greatly expanded. On-chip QD converted LEDs allow for applications in both display and lighting, where the price and configuration of LED bulbs prohibits QD solutions that rely on expensive hermetic seals. Furthermore, on-chip QD converted LEDs do not require additional bulky films or light bars that can potentially prohibit their use in certain applications such as mobile displays, where thin designs are highly desired. Lighting and display applications have somewhat unique challenges, so each one is discussed separately later. Since the tunability of QDs is well established and covers the entire visible spectrum [10], the primary focus in this report is to discuss the importance of narrow linewidths and to forecast (and verify using results from actual QD converted LEDs) the improvements attainable via on-chip QD converted LEDs in the near term. This is assessed through single-particle emission studies of Cd-based QDs followed by extensive modeling.

    2. QUANTUM DOTS FOR ON-CHIP USE

    The particles used in this study are cadmium-based core/shell nanocrystals and are made in a multi-step synthetic process. Specifically, several rounds of high-temperature air-free synthesis are used to make CdSe cores followed by multiple semiconductor layers. Subsequently, the QDs are coated with an inorganic barrier layer, which results in a powder as the final form of the material used for on-chip LEDs. Note that at this stage, the QDs are now found in aggregates. Thus, it is no longer possible to assess semiconductor properties such as absorption because scattering greatly overwhelms absorption in the extinction signal. Due to this issue, some types of measurements such as absorption (Fig. 1) and single-particle measurements are performed prior to the barrier layer synthesis step.

    Single-particle optical characteristics compared to ensemble. Top Graph: ensemble absorption HWHM of the first exciton peak for CdSe cores. Experimental batches represent attempts to achieve a narrower size distribution of QD cores. Middle Graph: FWHM comparison; single particles (solid bars) range from 7 to 15 nm narrower than ensemble (dashed bars). Bottom Graph: centroid comparison; single particles (solid bars) are typically within a few nm of ensemble measurements in solution (dashed bars), though there exist samples with large discrepancies.

    Figure 3.Single-particle optical characteristics compared to ensemble. Top Graph: ensemble absorption HWHM of the first exciton peak for CdSe cores. Experimental batches represent attempts to achieve a narrower size distribution of QD cores. Middle Graph: FWHM comparison; single particles (solid bars) range from 7 to 15 nm narrower than ensemble (dashed bars). Bottom Graph: centroid comparison; single particles (solid bars) are typically within a few nm of ensemble measurements in solution (dashed bars), though there exist samples with large discrepancies.

    Confirmed single-QD measurements from Production Batch 1 (n=48). Top Graph: overlaid spectra showing wide range of center wavelengths and intensities. Middle Left: FWHM versus centroid; the linear fit indicates little to no relationship. Middle Right: histogram of FWHM measurements. Bottom Left: lifetime versus FWHM; the linear fit shows a strong correlation. Bottom Right: histogram of lifetime measurements.

    Figure 4.Confirmed single-QD measurements from Production Batch 1 (n=48). Top Graph: overlaid spectra showing wide range of center wavelengths and intensities. Middle Left: FWHM versus centroid; the linear fit indicates little to no relationship. Middle Right: histogram of FWHM measurements. Bottom Left: lifetime versus FWHM; the linear fit shows a strong correlation. Bottom Right: histogram of lifetime measurements.

    Confirmed single-QD measurements from Experimental Batch 2 (n=40). Top Graph: overlaid spectra showing wide range of center wavelengths and intensities. Middle Left: FWHM versus centroid; the linear fit indicates a strong relationship between the two. The range of FWHM values is greater than the Production Batch. Middle Right: histogram of FWHM measurements. Bottom Left: lifetime versus FWHM; the linear fit shows a strong correlation. Bottom Right: histogram of lifetime measurements.

    Figure 5.Confirmed single-QD measurements from Experimental Batch 2 (n=40). Top Graph: overlaid spectra showing wide range of center wavelengths and intensities. Middle Left: FWHM versus centroid; the linear fit indicates a strong relationship between the two. The range of FWHM values is greater than the Production Batch. Middle Right: histogram of FWHM measurements. Bottom Left: lifetime versus FWHM; the linear fit shows a strong correlation. Bottom Right: histogram of lifetime measurements.

    The quantum efficiency (QE) of these QDs is measured at several stages. After the initial QD synthesis, the QE measurements are made as a dilution of QDs into toluene and have QE values as high as 90%. As a QD powder, the emission wavelength shifts only minimally (1  nm), while the FWHM of the emission is practically unchanged. The QD powders are then mixed with silicone and dispensed onto glass coverslips and into LEDs. After curing, the QD films and LED emission characteristics depend on the conditions. Since the QDs investigated in this report are produced from semiconductor materials, they thereby exhibit temperature-induced shifts to both emission wavelength and linewidth. The linear coefficients for these QDs are Δλ=0.125  nm/K and ΔFWHM=0.055  nm/K. Note that while the temperature shifts fit very well to the Varshni equation [11], this model is well-approximated by a linear fit over the range of standard LED operating temperatures. Given that the most common units used for color metrics are in wavelength rather than energy, the wavelength shifting and broadening coefficients are reported here for convenience. At room temperature, the QDs embedded in silicone again can have QE values of 90% (depending on the flux, loading conditions, etc.) with emission wavelengths and FWHM values that match the solution measurements performed at earlier stages.

    The wavelength shifting and emission broadening of QDs at elevated temperatures cannot be ignored as it can lead to dramatic color shifts and have impacts on many color metrics. In this regard, proper design of QD-based LED products should account for anticipated shifts from ambient conditions to operating temperatures. This temperature dependence of wavelength is a fundamental property of semiconductors and thus an inevitable trade-off that must be dealt with when taking advantage of the other benefits afforded by QD materials.

    3. SINGLE-PARTICLE EMISSION SPECTRA

    In order to ascertain the lower limits of QD emission linewidth, single-particle QD spectra were acquired. An important question is that of the origin of ensemble QD linewidth. Since QD emission wavelengths are size dependent, conventional wisdom dictates that the linewidth arises from the convolution of size heterogeneity and the intrinsic linewidth.

    Single QD spectra were acquired from specimens prepared by dropcasting QDs onto glass coverslips. Samples were prepared from a concentrated QD stock solution stored in toluene. To break up aggregates and minimize sampling errors, each stock solution was vortexed for 15 s and sonicated for at least 5 min immediately prior to dilution. Prior to dropcasting, the sample was diluted three times in a 6:1 cyclohexane/decane mixture. All samples were measured at ambient conditions. Due to the sequential nature of single-particle measurements, the time between sample preparation and measurement varies for each single QD measurement. The longest time elapsed for any such measurement was around 5 h. There was no observable trend with time elapsed since sample preparation. Sample selection bias was minimized by imaging a large area and measuring each dot within that area regardless of brightness. Clusters and quenched QDs were discarded during the data analysis phase.

    Single-particle data were collected with a 100× high-numerical-aperture oil objective (NA=1.3) as part of a custom-built microscope. The excitation source was a 450 nm ps pulsed laser at a repetition rate of 2.5 MHz (Picoquant PDL 800-D). After passing through a 484 nm dichroic mirror followed by a 473 nm emission filter, photons were routed via beamsplitter to either a spectrometer or a pair of single-photon sensitive avalanche photodiodes (SPADs) (MPD PD-050) arranged in a Hanbury Brown and Twiss interferometric detection scheme. This configuration allows for the simultaneous collection of spectra as well as time-tagged photoluminescence. Spectra were recorded using a 1/3 m spectrometer (Andor Shamrock SR-303i-B) utilizing a 100 μm entrance slit, and a 299 l/mm grating centered at 630 nm onto a CCD cooled to 80°C (Andor IDUS 401). The integration time per frame is 18 s, and a total of 10 spectra were collected for each dot investigated. For each frame, several emission characteristics are calculated including the centroid wavelength and FWHM of the emission. Time-resolved data from the SPADs were recorded with a dual-channel, time-correlated, single-photon-counting module with a common sync channel (Picoquant HydraHarp 400). Data were recorded in a time-tagged mode such that relevant post-processing could be done offline. The analysis performed on each dot includes PL blinking trajectories, lifetime decays, g2(τ) anti-bunching plots, and time-gated g2(τ) measurements as described in [12].

    Roughly 60 presumed single dots were measured for each QD batch of interest. Particles were deemed to be single if they met the criteria of having an area ratio of center-peak to side-peaks in the g2(τ) antibunching plot of less than 0.5 and a time-gated area ratio (RTG) of RTG<0.15. These criteria represent the gold standard for determination of a single QD emitter and lead to high confidence that the particles are in fact single [12,13]. After determination of single particles, the corresponding spectra are included in the analysis set. The brightest image frame from each dot is used for the data reported here.

    The single-particle spectra are compared to their ensemble solution-based measurements, as seen in Fig. 3. Inasmuch as the centroid wavelength is more relevant to LED color metrics than the peak wavelength, centroid wavelengths are reported rather than peak wavelength values. The median single-particle wavelength tends to be bluer than the ensemble wavelength. Possible reasons for this include skewed distribution of particles, selection bias, particle oxidation, or variable ligand coverage and solvent effects.

    There is a distinction made between production batches of QDs and experimental batches. In the experimental batches, a different synthesis recipe for CdSe cores was used that resulted in a narrower ensemble absorption spectrum. The size homogeneity of CdSe QDs can be judged in part by the half-width-half-maximum (HWHM) of the low-energy side of the first absorption peak. These experimental batches have a significantly narrower HWHM (50  meV) compared to production batches (74  meV). From these data, the experimental batches of CdSe cores were deemed to be successful; however, the resulting experimental core-shell particles showed inconsistent behavior. In one case, there was a new reduction in FWHM while the other experimental batch, which also stemmed from a narrow size distribution of cores, led to worse FWHM at the core-shell level. The primary difference between the synthesis of these batches is simply that experiential batch 1 was targeted to a slightly redder wavelength and thus was run for slightly longer time, but had otherwise similar conditions. The single-particle spectra shown in the following sections attempt to find the cause for the large FWHM observed in Experimental Batch 2, as seen in Fig. 3.

    As seen in Fig. 4, there is a significant fraction of the QD population in production batches that has emission centroid values less than 610 nm. In contrast, the experimental batches based on a narrow linewidth seed recipe shown here are devoid of QDs emitting to the blue of 610 nm, but rather show a spread in distribution that skews to the red (Fig. 5). In particular, the absence of this population in the experimental batches indicates that the narrower absorption peak of the experimental batch is a result of a narrower distribution of core sizes as was thought to be the case from HWHM data of their parent QD cores.

    The median single-particle FWHM is anywhere from 7 to 15 nm narrower than the ensemble FWHM, depending on recipe as seen in Fig. 3. When plotting the FWHM against the wavelength (Fig. 4) for production batches, there is no correlation (r=0.13). Surprisingly however, for the experimental batches as exemplified by Fig. 5, there is a strong positive correlation (r=0.83). As the FWHM of the particle increases, so does the wavelength. In particular, this effect is significantly larger than expected if the energy spread of the particle remains constant. This discrepancy can be explained in a number of ways. The first is that the increased wavelength distribution of the production batches washes out any observed correlation (Simpson’s Paradox). However, this explanation is unsatisfactory because it does not account for the suppression of the range of individual FWHMs observed in the production batch. Furthermore, the range of particle FWHMs is not attributable solely to the core recipe, as other experimental batches have shown both the small range of individual FWHMs and narrow wavelength distributions.

    The conclusion is that multiple mechanisms are responsible for the optical characteristics of our QDs. Core size has a large effect on the final particle wavelength but a smaller effect on the final particle FWHM. Interestingly, in Experimental Batch 2, there are many instances where some confirmed single particles have linewidths that actually exceed the ensemble average.

    While collecting the single-particle data, the excited-state lifetime of each QD is also measured. There is a strong linear correlation (r=0.83 for Production Batch 1, r=0.92 for Experimental Batch 2) between the lifetime and the FWHM of each particle. Furthermore, the spread in the lifetime data is so large that differences in lifetime cannot simply be attributed to differences in shell layer thickness and subsequent electron delocalization of the electronic wavefunction. Therefore, the large 50–100 ns spreads in lifetime observed here suggest that some other mechanism is at play. While the exact nature of this effect is not currently known, some hypotheses seen in other single-QD studies are considered.

    Early reports of single QDs showed that fluorescence intermittency is correlated to spectral shifts. These shifts were attributed to a quantum-confined Stark effect wherein electric fields due to QD charging are responsible for shifts in wavelength on the timescale of seconds [14,15]. This is unlikely to be the case in these QDs, as this would manifest as a clear change in lifetime of the single dots, a phenomenon that is not observed here. Furthermore, there is no observed correlation between wavelength and emission intensity, where a correlation might indicate that QD absorption (and thus size) or stability (attributed to better surface ligand coverage) could account for simultaneous differences in lifetime and wavelength.

    The cause of the concomitant increase in Centroid, FWHM, and Lifetime can most easily be attributed to the presence of defect states that lie within the band gap. Recombination from these lower-energy sites would naturally lead to redshifted emission, and a multiplicity of states can account for increased FWHM. As this could be attributed to either electron or hole defect sites, further studies wherein CdSe seeds are directly studied in a different matrix are proposed.

    Some strategies for arriving at narrow FWHM QD samples focus on making a homogenous size distribution of particles. This can be accomplished through design improvements to synthesis schemes as well as through processing wherein size selection can be performed, albeit at the expense of yield. From these single-particle data, it is clear that arriving at a mono-disperse size population is only part of the strategy for obtaining narrow linewidths of core-shell QDs. As shown here, relatively narrow size distributions of CdSe QD cores do not necessarily result in narrow-emission linewidths of resulting core-shell particles. The FWHM of single-particles can also be relatively large as a result of shell growth. While the mechanism for wide-FWHM core-shell single particles is still under investigation, it is clear that strategies to improve narrow emission must rely also on the quality of the shell growth. Regardless of the differences observed in shell growth or the initial homogeneity of the CdSe cores, the minimum observed FWHM of single particles is only slightly below 20 nm. This means that further changes to minimize QD core size variations and further improvements to applying semiconductor shell layers are unlikely to result in emission linewidths narrower than 20 nm. In this regard, the near-term limit to FWHM of QDs that are robust enough to withstand the rigors of on-chip testing is estimated to be 20 nm.

    4. LIGHTING

    The narrow bandwidth of QDs is one of the greatest opportunities to improve LED efficacy in lighting as it enables a dramatic improvement in luminous efficacy of radiation (LER). Here, the LER is calculated for a spectrum as the luminous output divided by the radiative output. State-of-the-art red phosphors emit a significant portion of the light at wavelengths where the eye has little sensitivity. In this regard, the red output contributes to the radiative output but only minimally to the luminous output, resulting in lowered LER values for spectra that have a significant fraction of red light. This is especially true for warm-white LEDs with high color-rendering requirements, which put stringent demands on the amount of light emitted in the red wavelength range at the edge of the visible spectrum. Narrow red converters can enable the same chromaticity and color-rendering quality in a spectrum with a high LER only if the emission is tunable. By precisely locating the narrow red emission at the appropriate wavelengths, high-quality light can be achieved while minimizing emission where the eye is not sensitive. For example, at a correlated color temperature (CCT) of 3000 K, color-rendering index (CRI) Ra>90, and R9>50, the maximum LER based on a state-of-the-art all-phosphor solution (Nichia NF2L757G-V1F1) is 307 lm/W [16], while a 30 nm FWHM red converter enables a maximum LER of 353 lm/W—a 15% improvement over a highly engineered product. This LER gain generally translates into an overall efficacy gain of the LEDs.

    Current LEDs used in lighting and display utilize a blue LED emitting in the range of 450 nm with phosphors such as YAGs and nitrides doped with rare-earth metals such as cerium, europium, etc., Commonly, a two-phosphor system is utilized; yellow–green and a red plus the blue LED give an RGB system that can be tuned for a desired white point. For lighting, the highest LERs can be achieved via a combination of narrow emitters [17,18], but the use of multiple narrow emitters is not necessary. Given the high efficiency and highly stable traditional green phosphors available, these can be used in combination with narrow-band emitters such as QDs. This strategy maximizes and utilizes the strengths of both materials and is ideal for many lighting scenarios. While the benefits of a broad green in combination with a narrow red have been discussed elsewhere [19,20], the authors are not aware of any examples of demonstrated devices capable of prolonged operation, especially when exposed to high-stress conditions.

    When striving for more efficient lighting, the quality of the light is paramount. Previous generations of efficient lighting such as fluorescent were often criticized for poor color quality. In this regard, the focus here is on those lighting solutions that meet the highest color standards.

    Two different sets of QD-based test devices have been made: one batch targeted to warm white (2871 K) and another targeted to a cooler white CCT (4020 K). These devices were measured at operating conditions; spectra were acquired at 60°C and a 75 mA drive current. The test devices were made from a 3535 LED package courtesy of Lumileds. These packages emit nominally 450 nm blue light. Phosphor powders obtained from Intematix NYAG4355 (for 2800 K devices) or NYAG4156 (for 4000 K devices) plus red QDs were mixed with optical-grade silicone dispensed into the 3535 packages and cured at 150°C for several hours.

    The resulting spectra were broken down into their various parts using a multi-peak fitting algorithm to model each component as a collection of six Gaussian curves: the blue LED modeled by two curves, the phosphor modeled by three curves, and the QD emission modeled by a single Gaussian. The total number of blue photons initially output by the LED die was calculated using the known QE for both the phosphor and QD at operating temperature.

    Two different computational models have been run based on the test devices. Since the basis spectra for the modeling were acquired at 60°C, the modeling is representative of QDs at operating temperatures. The aim is to ascertain the size of improvements that can be made to lighting efficiency by further optimizing QD emission output characteristics. The modeling is based on the spectra obtained from the actual devices; a fixed-photon simulation was done, meaning that the number of photons as emitted by the LED die was held constant while various inputs were altered. Specifically, the QD emission wavelength FWHM, QE, and loading in addition to the phosphor loading were all varied in this model. In each modeled spectrum, all photons were accounted for, meaning a broadening of FWHM lowered the Gaussian peak (for a given QE). Furthermore, loading curves for both QDs and phosphors were established from another set of test devices such that increasing the loading of a given downconverter does not linearly translate to the photons emitted but rather follows the loading curve previously determined. In this regard, all modeled spectra represent real devices that could be made given the existence of the proper QD emission wavelengths and FWHM values. This is an important distinction between this work and previous models [17,18], since the ability to realize a spectrum depends strongly on not only emission characteristics, but also on absorption traits of the QDs. Here, as this model starts from QDs with a given absorption, real loading curves for each constituent account for (at least in part) the effects of scattering and self-absorption. From experience, not all hypothetical spectra are achievable. As QD loading increases, the output is nonlinear and turns over, meaning that exceedingly high loadings might be required to reach a hypothetical spectrum. This can be problematic in practical terms of excessive loading leading to uncured polymer in LEDs. In this regard, every attempt has been made to represent real devices.

    A total of 2.7×10⁷ variations were computed for each color temperature, with the ranges of parameters as seen on Table 1. In each case, a full suite of standard lighting metrics was calculated for each spectrum modeled, including the LER reported in lumens per watt, the CCT, the CRI, and all of its components, especially the important R9 parameter. Additionally, the color quality scale (CQS) is calculated, as there are some instances where a spectrum can meet CRI criteria while offering poor color quality since the CRI is an imperfect metric [21,22]. The results are filtered to show only those meeting certain criteria of high color quality. The applied filters are reported on Table 2. Subsequently, any of the color metrics of the filtered data set can then be plotted. Figure 6 shows the importance of narrow emission, as LER is plotted against QD FWHM. For these models, the entire parameter space cannot be easily displayed. Instead, some of the more important dependencies amongst the parameters describing the QD performance are displayed below. In Figs. 6 and 7, the LER is plotted against the FWHM of the QD, while the QD is represented by the color scale. There are multiple permutations of loading, QE, wavelength, etc., that result in a given point on the plot. Hence, it must be understood that data points are layered on top of each other; in this case, the QE has been sorted such that the minimum allowable QE that achieves a given LER is layered on top. Importantly, narrow emitters lead to many possible permutations that yield a high LER. Figure 6 shows that, for very narrow FWHM values, all QD QE values in the study range can lead to CQS>87, CRI>90, R9>50, and LER>340  lm/W. Conversely, for broad emitters, reaching the metrics of CQS>87, CRI>90, and R9>50 requires higher QE values and still results in lower attainable LER values for a given green phosphor. The notion that a path to higher-efficiency lighting while meeting high color metrics via the combination of broad green phosphor plus a narrow red emitter is not new [19]. While such previous notions were simply theoretical, the realization of this scheme with QD converted LEDs is demonstrated here as indicated by the points labeled “QD” in Figs. 6 and 7.

    ParameterRangeStep Size
    QD QE0.5–1.00.05
    QD Wavelength605–645 nm0.4 nm
    QD FWHM15–115 nm0.5 nm
    QD Loading0.5×1.5× of test device0.1
    Phosphor Loading0.5×1.5× of test device0.1

    Table 1. Ranges and Step Sizes for Parameters Used in Modeling QD-Based LED Spectra

    Metric3000 K Data Set4000 K Data Set
    CRICRI Ra>90CRI Ra>90
    R9R9>50R9>50
    CQSCQS Qa>87CQS Qa>87
    DuvWithin 0.003 (UV space)Within 0.003 (UV space)
    CCT2700 K <CCT<3100  K3800 K <CCT<4200  K

    Table 2. Color Metric Filters Applied to Modeled Spectra

    Top: Several modeled spectra are shown. Red curve: FWHM=63 nm, red peak λ=643.4, QE=1.0, LER=298. Green curve: FWHM=35.5 nm, red peak λ=627, QE=0.75, LER=338. Purple curve: FWHM=15.5 nm, red peak λ=624.2, QE=0.5, LER=349. Bottom: LER versus FWHM results of filtered data set from modeling based on 3000 K device. The parameters and ranges of the model are found in Table 1. The data are filtered according to Table 2. The QE of the QDs is represented by the color scale. Points have been layered such that the minimum QE to attain a given LER is on top.

    Figure 6.Top: Several modeled spectra are shown. Red curve: FWHM=63  nm, red peak λ=643.4, QE=1.0, LER=298. Green curve: FWHM=35.5  nm, red peak λ=627, QE=0.75, LER=338. Purple curve: FWHM=15.5  nm, red peak λ=624.2, QE=0.5, LER=349. Bottom: LER versus FWHM results of filtered data set from modeling based on 3000 K device. The parameters and ranges of the model are found in Table 1. The data are filtered according to Table 2. The QE of the QDs is represented by the color scale. Points have been layered such that the minimum QE to attain a given LER is on top.

    LER versus FWHM results of filtered data set from modeling based on 4000 K device. The parameters and ranges of the model are found in Table 1. The data are filtered according to Table 2. The QE of the QDs is represented by the color scale. Points have been layered such that the minimum QE to attain a given LER is on top.

    Figure 7.LER versus FWHM results of filtered data set from modeling based on 4000 K device. The parameters and ranges of the model are found in Table 1. The data are filtered according to Table 2. The QE of the QDs is represented by the color scale. Points have been layered such that the minimum QE to attain a given LER is on top.

    Significantly, high LER values are not achievable by virtue of narrow QD emission linewidth alone. All the modeling parameters determine the spectral shape, including QD wavelength and QE. Since not all solutions for a given LER are unique, different combinations of parameters can lead to the same LER value. Interestingly, in some cases, high LER values can be achieved by relatively low QE values. Of course, the overall efficiency of a device will be higher with higher QE values. In a related manner, highly tunable emission wavelength is the other key characteristic that allows for simultaneously reaching high LER while also meeting strict color metrics. As higher LER is demanded, by necessity, the QD wavelength must also blueshift. This represents a problem for some narrow-band phosphors that are not readily tunable such as potassium fluorosilicates, whereas this is not an issue for QDs as they are highly tunable. As seen in Fig. 8, a narrow FWHM coupled with a tunable wavelength helps to achieve the maximum LER at a given CCT.

    LER versus QD peak wavelength from filtered data set from modeling based on 3000 K device. The parameters and ranges of the model are found in Table 1. The data are filtered according to Table 2.

    Figure 8.LER versus QD peak wavelength from filtered data set from modeling based on 3000 K device. The parameters and ranges of the model are found in Table 1. The data are filtered according to Table 2.

    5. DISPLAY

    It is well known that, to achieve improved color metrics in lighting as well as increased gamut in display technologies, it is highly desirable to obtain a downconverter having a narrow emission linewidth [23,24]. In this section, the practical limits of gamut coverage using on-chip QD LEDs are discussed. To make a fair comparison between color gamuts of various display spectra, both the color space used and the method of comparison to specified gamuts must be consistent. As the most challenging gamut to achieve is that of Recommendation ITU-R BT.2020 (Rec. 2020), this will be the bar against which QDs are measured. Here, the CIE 1931 xy color space is used because, as discussed elsewhere, gamuts that are calculated in the CIE 1931 space “are much more correlated to the Rec. 2020 volume-coverage ratios in some color-appearance spaces” [25,26]. In particular, rather than simply comparing ratios of gamut areas, the intersection of the Rec. 2020 gamut with modeled QD LED gamuts is calculated.

    While current LED backlight QD-based displays have tuned emission peak wavelengths for an optimal color, further increasing the Rec. 2020 coverage will come from reduced FWHM of the emission. An example of a QD converted LED for back light unit (BLU) applications is seen in Fig. 9. In a similar fashion as before, this spectrum is used as the basis for modeling of an RGB BLU spectrum. The QD emission characteristics are modeled as a function of wavelength, FWHM, and loading; the range of parameters used in the model is found in Table 3. The Blue peak is modeled by two Gaussian profiles, while single Gaussian profiles represent green and red QD emission. The 7×10⁷ modeled spectra are filtered for white points that are close to the D65 color coordinates (within 0.003 x and 0.003 y) after passing through standard color filters (CF72).

    ParameterRangeStep Size
    Green Wavelength525–540 nm1.25 nm
    Green FWHM10–65 nm1.0 nm
    Green Loading0.75×1.25× of initial0.05
    Red Wavelength625–640 nm1.25 nm
    Red FWHM10–70 nm1.0 nm
    Red Loading0.75×1.25× of initial0.05

    Table 3. Ranges and Step Sizes for Parameters Used in Modeling QD Converted LED BLU Spectra

    Top: BLU spectrum comprised of green and red Cd-based QDs. While this spectra is representative of the FWHM values, further color tuning of the peak emission can result in much better gamut coverage. The CF72 color filters are also shown. Bottom: Modeling results showing the impact of FWHM on Rec. 2020 coverage as calculated in CIE 1931 color space. This plot includes all wavelength and loading combinations, but has been filtered such that the maximum achievable gamut for any FWHM point is layered on top. The color bar indicates the fraction of Rec. 2020 coverage. A black datum representing literature reports for InP QDs has been included for comparison.

    Figure 9.Top: BLU spectrum comprised of green and red Cd-based QDs. While this spectra is representative of the FWHM values, further color tuning of the peak emission can result in much better gamut coverage. The CF72 color filters are also shown. Bottom: Modeling results showing the impact of FWHM on Rec. 2020 coverage as calculated in CIE 1931 color space. This plot includes all wavelength and loading combinations, but has been filtered such that the maximum achievable gamut for any FWHM point is layered on top. The color bar indicates the fraction of Rec. 2020 coverage. A black datum representing literature reports for InP QDs has been included for comparison.

    After filtering all results, the fractional gamut coverage as a function of QD FWHM is plotted in Fig. 9. As this is intended to highlight realistic limits to QD gamut coverage, the model was run down to only FWHM values of 10 nm for both green and red QDs. Even if Cd-free QDs were able to withstand the rigors of on-chip applications, their current linewidths do not present much of an advantage over existing technologies such as OLED displays. A theoretical Cd-free InP-based QD data point has been added to Fig. 9 utilizing a green FWHM of 50 nm and red FWHM of 65 nm [5]. This would result in a maximum gamut coverage of 66.7%. Current state-of-the-art QD TV offerings from Samsung, which utilize indium-based QDs, have a reported gamut coverage of 68.6%, in line with a best estimate for what should be achievable with InP QDs based on literature reports [27,28]. In comparison, using linewidths currently available to cadmium-based QDs (30  nm), a coverage of over 80% is achievable with these simplistic un-optimized filters. This is a dramatic improvement over the best TV products readily available in the market today, which achieve coverage of only 70.45% of Rec. 2020 in XY space using an OLED display as reported by [28]. By deconstructing the spectra of the highest-gamut TVs on the market today (November 2016), the narrowest linewidths found for green and red are 31 and 39 nm, respectively. According to this model, 80% of Rec. 2020 can be achieved by these FWHM values. Optimizing color filters will likely give only a slight boost since Cd-based QD displays have reported Rec. 2020 coverage of 81% [29]. These FWHM values fall within the ranges typical of Cd-based QDs, which are likely utilized. The modeled gamuts for Cd QDs and InP QDs can be seen in Fig. 10. Even with FWHM values going down to 10 nm, the maximum achievable gamut in this model still only approaches 85% Rec. 2020. Optimized filters again may increase this value slightly. While this is a substantial gain, moving to numbers higher than 85% coverage will require different technology than QD downconverters. Likely more expensive solutions such as lasers will be needed to exceed this limit.

    Modeling results for Rec. 2020 coverage. The Rec. 2020 gamut is defined by the black dashed line. The D65 white point and Planckian locus are identified as well. The gamut attainable via use of Cd-based QDs is specified by the purple triangle while that of a leading InP QD system is shown as an orange triangle. As is conventionally done, these are measured/calculated at room temperature. The Cd-based QD has coverage of 80.8% Rec. 2020, while the InP-based QD has coverage of 66.7%.

    Figure 10.Modeling results for Rec. 2020 coverage. The Rec. 2020 gamut is defined by the black dashed line. The D65 white point and Planckian locus are identified as well. The gamut attainable via use of Cd-based QDs is specified by the purple triangle while that of a leading InP QD system is shown as an orange triangle. As is conventionally done, these are measured/calculated at room temperature. The Cd-based QD has coverage of 80.8% Rec. 2020, while the InP-based QD has coverage of 66.7%.

    While the QD literature often cites emission linewidths at room temperature, it is important to know the FWHM at operating temperatures for displays. As mentioned, the Cd-based QDs presented here have wavelength and FWHM temperature dependencies that are well fit by a linear model for temperatures starting at room temperature and extending to LED operating temperatures up to 150 K. The linear temperature shift coefficients for CdSe QDs are 0.125 nm/K for wavelength shifting and 0.055 nm/K for linewidth broadening. Inasmuch as this is a property of semiconductors and that exciton recombination happens within the CdSe core, these numbers hold for a variety of shell permutations including both thick and thin shells. In a similar fashion, the InP literature was used to extract linear fit coefficients [6]. The slope of the wavelength shifting for InP is determined to be 0.10 nm/K, roughly similar to CdSe. However, the FWHM broadening is fit to a linear model with a slope found to be 0.11 nm/K, double that of CdSe. It is unclear if this coefficient for temperature-induced FWHM broadening is a fundamental property of InP or specific to the cited preparation for the QDs in question. This again emphasizes the need to compare QD emission characteristics such as peak wavelength or FWHM at comparable temperatures and conditions.

    6. CONCLUSIONS

    This new QD technology has allowed for the first commercial implementation of on-chip QD downconverters as a direct phosphor replacement. In collaboration with Lumileds, an acknowledged LED pioneer, QD materials have been shown to meet the requirements for commercial realization. Based on single-particle measurements taken on both production and experimental QD batches, the lower limit in emission linewidth for Cd-based QDs is estimated to be 20 nm using current synthesis paradigms. Achieving this linewidth on-chip with a tunable wavelength represents a significant improvement to the maximum achievable efficiency for solid-state lighting products. Furthermore, this narrow-emission linewidth coupled with high tunability allows for greatly improved color metrics while maintaining high LER values.

    Acknowledgment

    Acknowledgment. Thanks to the entire team at Pacific Light Technologies, the many QD synthesis experts and test experts who made this work possible by providing high-quality materials, data, and support. Also, thanks to the R&D and Product Development teams at Lumileds that have supported this collaboration by providing LEDs, expertise, and feedback as well as independent test verification of QD samples.

    References

    [1] J. Lee, V. C. Sundar, J. R. Heine, M. G. Bawendi, K. F. Jensen. Full color emission from iivi semiconductor quantum dot–polymer composites. Adv. Mater., 12, 1102-1105(2000).

    [2] V. L. Colvin, M. C. Schlamp, A. P. Alivisatos. Light-emitting diodes made from cadmium selenide nanocrystals and a semiconducting polymer. Nature, 370, 354-357(1994).

    [3] N. Bardsley, S. Bland, M. Hansen, L. Pattison, M. Pattison, K. Stober, M. Yamada. Solid-state lighting R&D plan(2016).

    [4] K. T. Shimizu, M. Böhmer, D. Estrada, S. Gangwal, S. Grabowski, H. Bechtel, E. Kang, K. Vampola, D. Chamberlin, O. B. Shchekin, J. Bhardwaj. Towards commercial realization of quantum dot based white LEDs for general illumination. Photon. Res., 5, A1-A6(2017).

    [5] J. P. Park, J.-J. Lee, S.-W. Kim. Highly luminescent InP/GaP/ZnS QDs emitting in the entire color range via a heating up process. Sci. Rep., 6, 30094(2016).

    [6] A. Narayanaswamy, L. F. Feiner, P. J. van der Zaag. Temperature dependence of the photoluminescence of InP/ZnS quantum dots. J. Phys. Chem. C, 112, 6775-6780(2008).

    [7] M. J. Anc, N. L. Pickett, N. C. Gresty, J. A. Harris, K. C. Mishra. Progress in non-Cd quantum dot development for lighting applications. ECS J. Solid State Sci. Technol., 2, R3071-R3082(2013).

    [8] S. J. Yang, J. H. Oh, S. Kim, H. Yang, Y. R. Do. Realization of InP/ZnS quantum dots for green, amber and red down-converted LEDs and their color-tunable, four-package white LEDs. J. Mater. Chem. C, 3, 3582-3591(2015).

    [9] S. Tamang, C. Lincheneau, Y. Hermans, S. Jeong, P. Reiss. Chemistry of InP nanocrystal syntheses. Chem. Mater., 28, 2491-2506(2016).

    [10] B. O. Dabbousi, J. Rodriguez-Viejo, F. V. Mikulec, J. R. Heine, H. Mattoussi, R. Ober, K. F. Jensen, M. G. Bawendi. (CdSe)ZnS coreshell quantum dots: synthesis and characterization of a size series of highly luminescent nanocrystallites. J. Phys. Chem. B, 101, 9463-9475(1997).

    [11] Y. P. Varshni. Temperature dependence of the energy gap in semiconductors. Physica, 34, 149-154(1967).

    [12] B. D. Mangum, Y. Ghosh, J. A. Hollingsworth, H. Htoon. Disentangling the effects of clustering and multi-exciton emission in second-order photon correlation experiments. Opt. Express, 21, 7419-7426(2013).

    [13] G. Nair, J. Zhao, M. G. Bawendi. Biexciton quantum yield of single semiconductor nanocrystals from photon statistics. Nano. Lett., 11, 1136-1140(2011).

    [14] S. A. Empedocles, M. G. Bawendi. Quantum-confined Stark effect in single CdSe nanocrystallite quantum dots. Science, 278, 2114-2117(1997).

    [15] R. G. Neuhauser, K. T. Shimizu, W. K. Woo, S. A. Empedocles, M. G. Bawendi. Correlation between fluorescence intermittency and spectral diffusion in single semiconductor quantum dots. Phys. Rev. Lett., 85, 3301-3304(2000).

    [16] . Nichia Product Page NF2L757G-V1F1(2016).

    [17] T. Erdem, S. Nizamoglu, X. W. Sun, H. V. Demir. A photometric investigation of ultra-efficient LEDs with high color rendering index and high luminous efficacy employing nanocrystal quantum dot luminophores. Opt. Express, 18, 340-347(2010).

    [18] P. Zhong, G. He, M. Zhang. Optimal spectra of white light-emitting diodes using quantum dot nanophosphors. Opt. Express, 20, 9122-9134(2012).

    [19] Y. Ohno. Spectral design considerations for white LED color rendering. Opt. Eng., 44, 111302(2005).

    [20] P. Pust, V. Weiler, C. Hecht, A. Tücks, A. S. Wochnik, A.-K. Henß, D. Wiechert, C. Scheu, P. J. Schmidt, W. Schnick. Narrow-band red-emitting Sr[LiAl3N4]:Eu2+ as a next-generation LED-phosphor material. Nat. Mater., 13, 891-896(2014).

    [21] W. Davis, Y. Ohno. Color quality scale. Opt. Eng., 49, 033602(2010).

    [22] W. Davis, Y. Ohno. Toward an improved color rendering metric. Proc. SPIE, 5941, 59411G(2005).

    [23] Z. Luo, D. Xu, S. T. Wu. Emerging quantum-dots-enhanced LCDs. J. Disp. Technol., 10, 526-539(2014).

    [24] J. S. Steckel, J. Ho, C. Hamilton, J. Xi, C. Breen, W. Liu, P. Allen, S. Coe-Sullivan. Quantum dots: the ultimate down-conversion material for LCD displays. J. Soc. Inf. Disp., 23, 294-305(2015).

    [25] K. Masaoka, Y. Nishida. Metric of color-space coverage for wide-gamut displays. Opt. Express, 23, 7802-7808(2015).

    [26] R. Zhu, Z. Luo, H. Chen, Y. Dong, S.-T. Wu. Realizing Rec. 2020 color gamut with quantum dot displays. Opt. Express, 23, 23680-23693(2015).

    [27] . Samsung TV Blog(2016).

    [28] . Wide Color Gamut Coverage of TVs(2016).

    [29] J. Ho. Achieving BT. 2020 color gamut quantum dots vs. lasers(2016).

    Benjamin D. Mangum, Tiemo S. Landes, Brian R. Theobald, Juanita N. Kurtin. Exploring the bounds of narrow-band quantum dot downconverted LEDs[J]. Photonics Research, 2017, 5(2): A13
    Download Citation