
Hao Zhang, Lei Yao, Yuyan Pang, Jun Xia, "Flexible and high-efficiency generation of arbitrary vector vortex beams on hybrid-order Poincaré sphere," Chin. Opt. Lett. 16, 092601 (2018)
- Chinese Optics Letters
- Vol. 16, Issue 9, 092601 (2018)
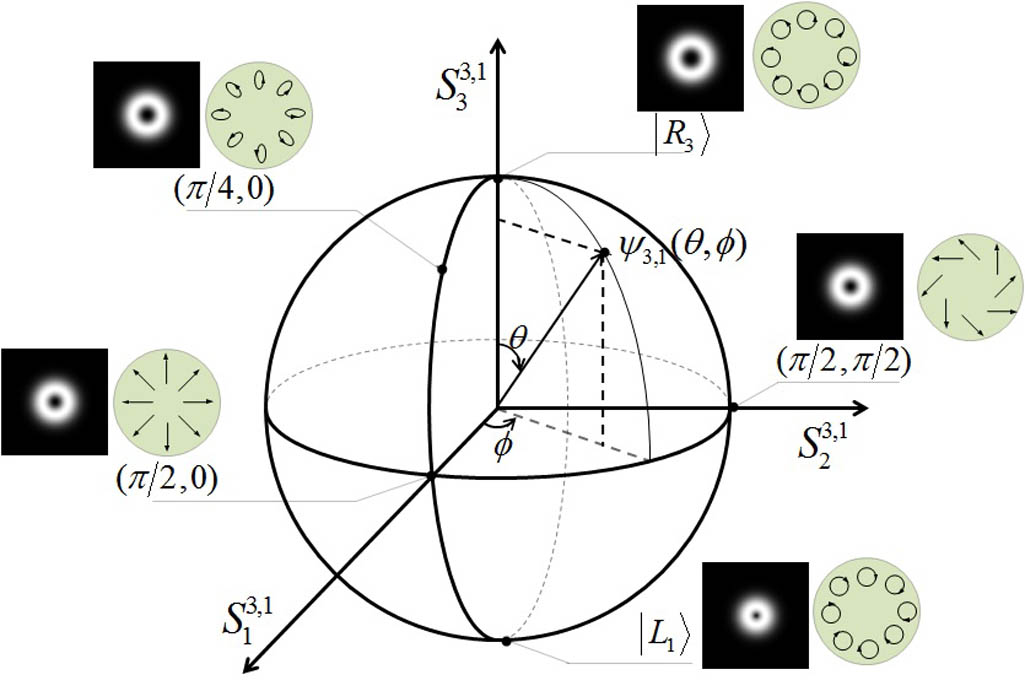
Fig. 1. Schematic illustration of HyOPS with l = 3 m = 1
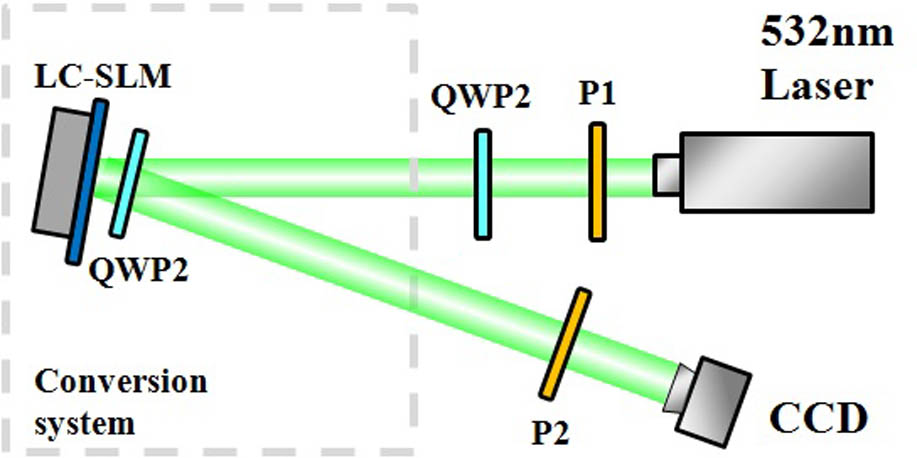
Fig. 2. Schematic of experimental arrangement for generating arbitrary vector vortex beams on the HyOPS.
Fig. 3. Generated states on equator of HyOPS under φ 0 = 0 δ ( V ) = 2 θ δ ( V ) = 2 θ + π δ ( V ) = 3 θ δ ( V ) = 4 θ
Fig. 4. Measurement results of normalized Stokes parameters S 0 , S 1 , S 2 S 3 φ 0 = π / 8 φ 0 = π / 4
Fig. 5. Schematic of the interference scheme for clarifying the phase distribution of the generated HyOPS states.
Fig. 6. Numerically simulated and experimentally observed interference patterns. First, second rows correspond to the generated HyOPS states with δ ( V ) = 2 θ δ ( V ) = 4 θ


Set citation alerts for the article
Please enter your email address

© Copyright 2018-2021 | Chinese Laser Press. All Rights Reserved 沪ICP备15018463号-20