• Matter and Radiation at Extremes
  • Vol. 6, Issue 1, 014405 (2021)
A. S. Martynenko1、*, S. A. Pikuz1、2, I. Yu. Skobelev1、2, S. N. Ryazantsev1、2, C. D. Baird3, N. Booth4, L. N. K. Döhl3, P. Durey3, A. Ya. Faenov1、5, D. Farley3, R. Kodama5、6, K. Lancaster3, P. McKenna7, C. D. Murphy3, C. Spindloe4, T. A. Pikuz1、5, and N. Woolsey3
Author Affiliations
  • 1Joint Institute for High Temperatures of the Russian Academy of Sciences, 125412 Moscow, Russia
  • 2National Research Nuclear University MEPhI, Kashirskoe Sh. 31, 115409 Moscow, Russia
  • 3York Plasma Institute, Department of Physics, University of York, York YO10 5DD, United Kingdom
  • 4Central Laser Facility, STFC Rutherford Appleton Laboratory, Didcot OX11 0QX, United Kingdom
  • 5Open and Transdisciplinary Research Initiative, Osaka University, Osaka 565-0871, Japan
  • 6Institute of Laser Engineering, Osaka University, Suita 565-0871, Japan
  • 7Department of Physics, SUPA, University of Strathclyde, Glasgow G4 0NG, United Kingdom
  • show less
    DOI: 10.1063/5.0025646 Cite this Article
    A. S. Martynenko, S. A. Pikuz, I. Yu. Skobelev, S. N. Ryazantsev, C. D. Baird, N. Booth, L. N. K. Döhl, P. Durey, A. Ya. Faenov, D. Farley, R. Kodama, K. Lancaster, P. McKenna, C. D. Murphy, C. Spindloe, T. A. Pikuz, N. Woolsey. Optimization of a laser plasma-based x-ray source according to WDM absorption spectroscopy requirements[J]. Matter and Radiation at Extremes, 2021, 6(1): 014405 Copy Citation Text show less
    Comparison of numerical photorecombination continuum emission spectra for a set of elements with atomic numbers Z = 13–16 and compounds sodium chloride and potassium chloride. Aluminum: grey polygon. Silicon: red. Phosphorus: blue. Sulfur: green. Sodium chloride: purple. Potassium chloride: violet. The positions of a few characteristic silicon lines of the resonance series of Ly-like Si (Si XIV, vertical solid lines in the figure) and He-like Si (Si XIII, vertical dashed lines) ions are indicated for clarity. The plasma parameters for each element were chosen individually (Table I). The ion densities ni were set to be equal to the solid density of the corresponding materials, whereas the electron density and temperature, ne and Te, were set to have a fixed sum: neTe+∑NkIk.
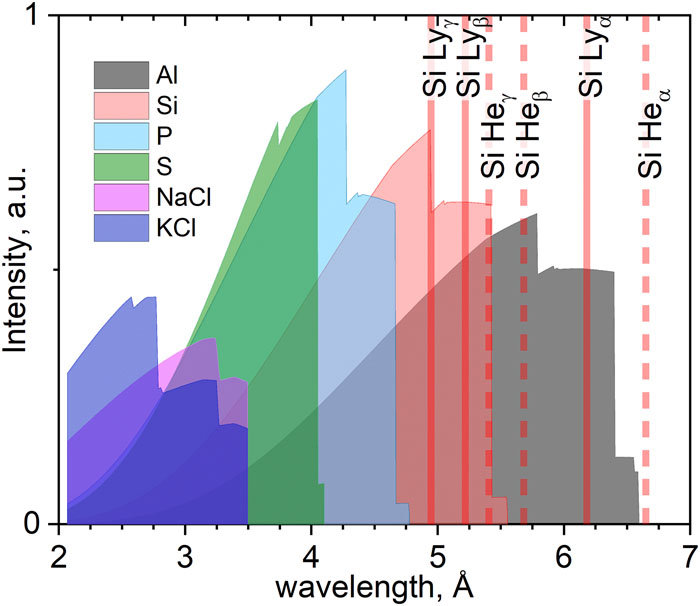
    Fig. 1. Comparison of numerical photorecombination continuum emission spectra for a set of elements with atomic numbers Z = 13–16 and compounds sodium chloride and potassium chloride. Aluminum: grey polygon. Silicon: red. Phosphorus: blue. Sulfur: green. Sodium chloride: purple. Potassium chloride: violet. The positions of a few characteristic silicon lines of the resonance series of Ly-like Si (Si XIV, vertical solid lines in the figure) and He-like Si (Si XIII, vertical dashed lines) ions are indicated for clarity. The plasma parameters for each element were chosen individually (Table I). The ion densities ni were set to be equal to the solid density of the corresponding materials, whereas the electron density and temperature, ne and Te, were set to have a fixed sum: neTe+NkIk.
    Top view of the experimental scheme. A solid target is irradiated by a p-polarized laser beam reflected from a focusing parabola and a plasma mirror. The front-side spectrometers are in the plane of the laser beam.
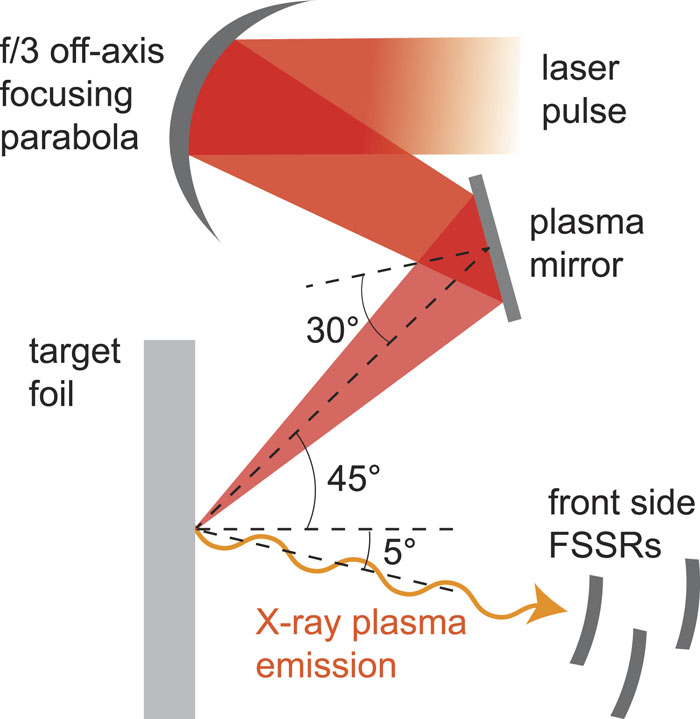
    Fig. 2. Top view of the experimental scheme. A solid target is irradiated by a p-polarized laser beam reflected from a focusing parabola and a plasma mirror. The front-side spectrometers are in the plane of the laser beam.
    Comparison of experimental data (grey curve) with a model spectrum (red curve). The experimental spectrum corresponds to 2-μm-Si-foil laser-plasma emission. The modeled spectrum is a sum of photorecombination, characteristic, and bremsstrahlung spectra; the last of these is indicated with a dotted blue curve. The orange rectangle indicates the wavelength range that is best suited for X-ray source based on Si (3 Å–4.8 Å).
    Fig. 3. Comparison of experimental data (grey curve) with a model spectrum (red curve). The experimental spectrum corresponds to 2-μm-Si-foil laser-plasma emission. The modeled spectrum is a sum of photorecombination, characteristic, and bremsstrahlung spectra; the last of these is indicated with a dotted blue curve. The orange rectangle indicates the wavelength range that is best suited for X-ray source based on Si (3 Å–4.8 Å).
    Dependences of experimentally measured conversion efficiencies on the thickness of solid foil targets: (a) emission from silicon targets integrated over the wavelength range 4.5 Å–5 Å and (b) emission from aluminum targets integrated over the range 5.15 Å–5.65 Å. The conversion efficiency is the ratio of the deposited laser energy and the energy of the emitted photons.
    Fig. 4. Dependences of experimentally measured conversion efficiencies on the thickness of solid foil targets: (a) emission from silicon targets integrated over the wavelength range 4.5 Å–5 Å and (b) emission from aluminum targets integrated over the range 5.15 Å–5.65 Å. The conversion efficiency is the ratio of the deposited laser energy and the energy of the emitted photons.
    Element or compoundZni × 1022 (ions/cm3)ne × 1023 (electrons/сm3)Te (eV)Mean chargePCE of H-like ion (Å)PCE of He-like ion (Å)
    Al1366.943011.55.616.18
    Si1456.248012.44.845.31
    P153.54.9625144.214.59
    S163.95.555014.13.663.96
    NaCl2.23115013.33.253.5
    KCl1.62.7125516.52.582.77
    Table 1. Ion density ni, electron density ne, and electron temperature Te, which determine the emission spectra in Fig. 2. The indicated PCEs of NaCl correspond to Cl only, whereas the PCEs of KCl correspond to K.
    A. S. Martynenko, S. A. Pikuz, I. Yu. Skobelev, S. N. Ryazantsev, C. D. Baird, N. Booth, L. N. K. Döhl, P. Durey, A. Ya. Faenov, D. Farley, R. Kodama, K. Lancaster, P. McKenna, C. D. Murphy, C. Spindloe, T. A. Pikuz, N. Woolsey. Optimization of a laser plasma-based x-ray source according to WDM absorption spectroscopy requirements[J]. Matter and Radiation at Extremes, 2021, 6(1): 014405
    Download Citation