• Photonics Research
  • Vol. 10, Issue 2, 444 (2022)
Yuefang Yan1、2、†, Yu Liu1、†, Haoyu Zhang1, Yue Li1, Yuwei Li1, Xi Feng1, Donglin Yan1, Jianjun Wang1, Honghuan Lin1, Feng Jing1, Wenhui Huang2, and Rumao Tao1、*
Author Affiliations
  • 1Laser Fusion Research Center, China Academy of Engineering Physics, Mianyang 621900, China
  • 2Key Laboratory of Particle & Radiation Imaging (Tsinghua University), Ministry of Education, Beijing 100084, China
  • show less
    DOI: 10.1364/PRJ.441384 Cite this Article Set citation alerts
    Yuefang Yan, Yu Liu, Haoyu Zhang, Yue Li, Yuwei Li, Xi Feng, Donglin Yan, Jianjun Wang, Honghuan Lin, Feng Jing, Wenhui Huang, Rumao Tao. Principle and numerical demonstration of high power all-fiber coherent beam combination based on self-imaging effect in a square core fiber[J]. Photonics Research, 2022, 10(2): 444 Copy Citation Text show less
    (a) Schematic diagram of a square core fiber waveguide. (b) Diagram of the transmission results and the beam spots.
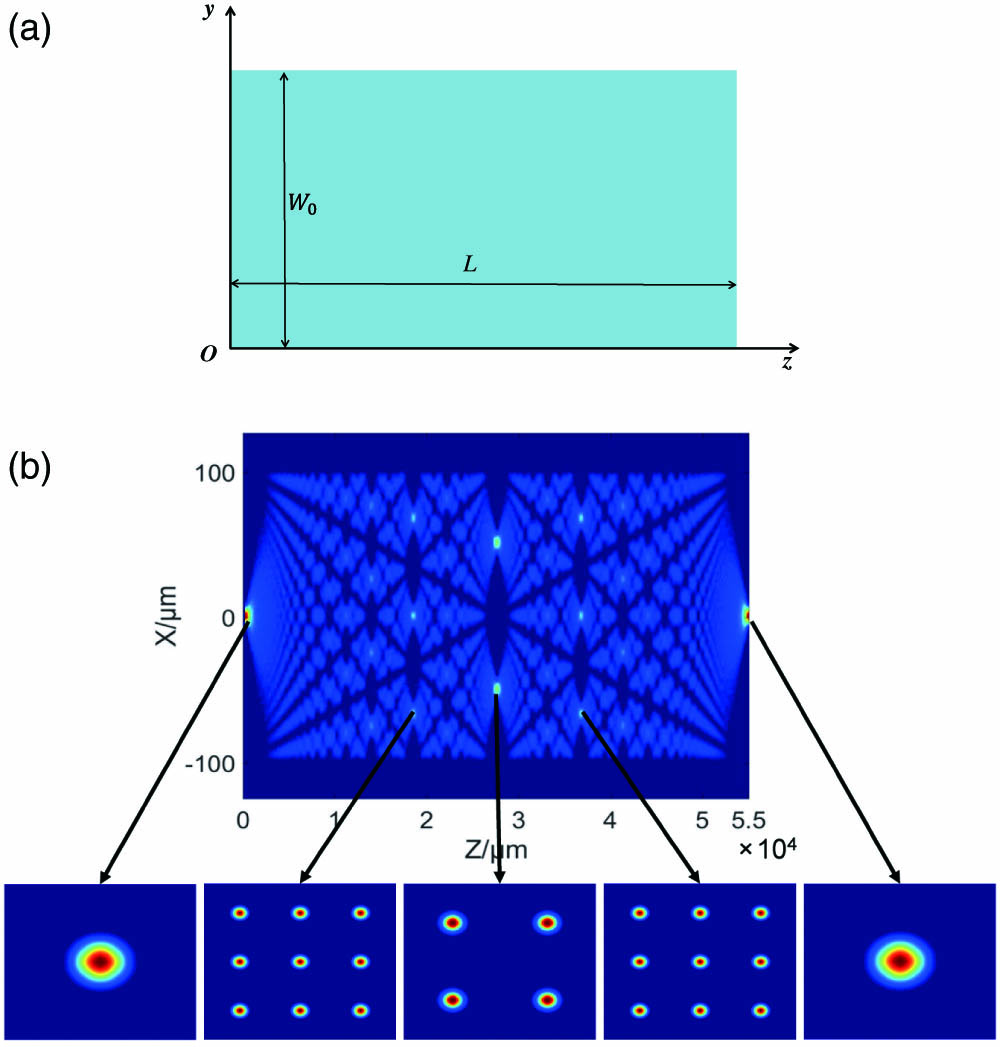
    Fig. 1. (a) Schematic diagram of a square core fiber waveguide. (b) Diagram of the transmission results and the beam spots.
    Diagram of the beam quality and beam profile at different integer multiple of the imaging length.
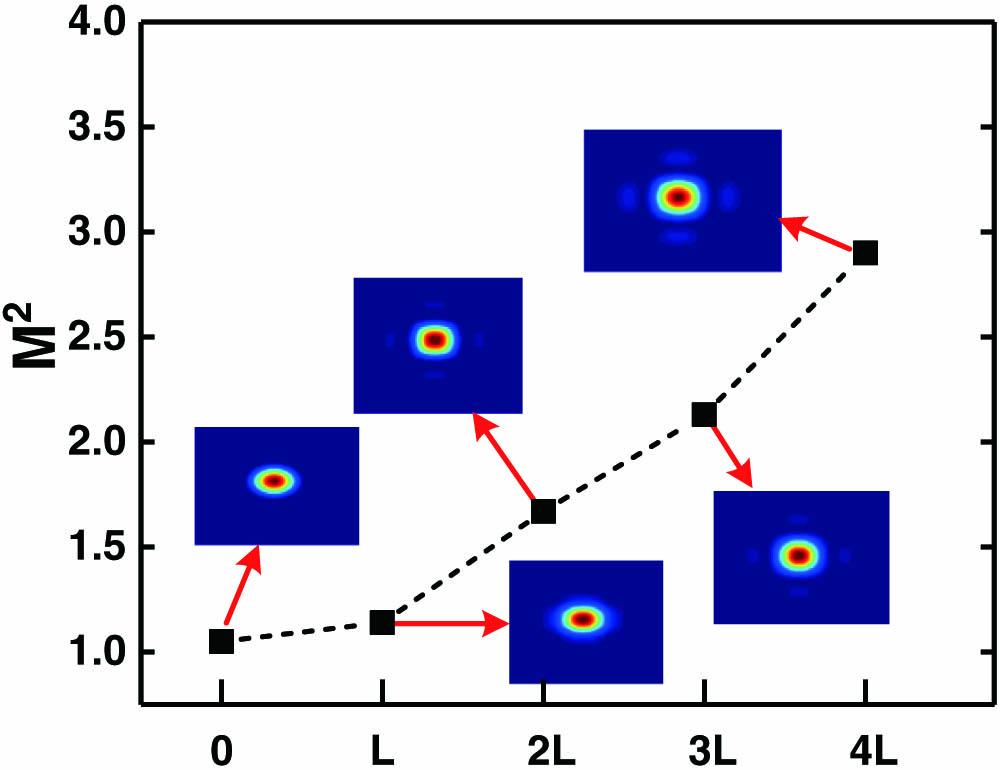
    Fig. 2. Diagram of the beam quality and beam profile at different integer multiple of the imaging length.
    (a) Schematic diagram of the beam combining device. (b) Schematic diagram of the all-fiber CBC system with a square fiber combiner.
    Fig. 3. (a) Schematic diagram of the beam combining device. (b) Schematic diagram of the all-fiber CBC system with a square fiber combiner.
    (a) Beam quality as a function of NA. (b) Beam efficiency as a function of NA.
    Fig. 4. (a) Beam quality as a function of NA. (b) Beam efficiency as a function of NA.
    (a) Beam quality as a function of fiber core size and square fiber core size. (b) Beam efficiency as a function of fiber core size and square fiber core size.
    Fig. 5. (a) Beam quality as a function of fiber core size and square fiber core size. (b) Beam efficiency as a function of fiber core size and square fiber core size.
    (a) Optimal beam quality as a function of fiber core size. (b) Beam efficiency as a function of fiber core size with W being six times the input fiber core size.
    Fig. 6. (a) Optimal beam quality as a function of fiber core size. (b) Beam efficiency as a function of fiber core size with W being six times the input fiber core size.
    (a) Beam quality as a function of NA with different fiber arrays. (b) Beam efficiency as a function of NA with different fiber arrays. (c) Diagram of typical intensity distribution of a 5×5 fiber array after combination. (d) Diagram of the intensity profiles of the combining beam spot of a 2×2 fiber array and a 5×5 fiber array along the x direction.
    Fig. 7. (a) Beam quality as a function of NA with different fiber arrays. (b) Beam efficiency as a function of NA with different fiber arrays. (c) Diagram of typical intensity distribution of a 5×5 fiber array after combination. (d) Diagram of the intensity profiles of the combining beam spot of a 2×2 fiber array and a 5×5 fiber array along the x direction.
    (a) Input intensity distribution with the 2×2 fiber array. (b) Output intensity distribution after combination with the 2×2 fiber array.
    Fig. 8. (a) Input intensity distribution with the 2×2 fiber array. (b) Output intensity distribution after combination with the 2×2 fiber array.
    (a) Diagram of output intensity distribution from the 2×2 fiber array. (b) Diagram of output intensity distribution after combination with the tilled aperture in the case of the 2×2 fiber array. (c) Diagram of output intensity distribution after combination with the square fiber in the case of the 2×2 fiber array. (d) Diagram of output intensity distribution from the 3×3 fiber array. (e) Diagram of output intensity distribution after combination with the tilled aperture in the case of the 3×3 fiber array. (f) Diagram of output intensity distribution after combination with the square fiber in the case of the 3×3 fiber array.
    Fig. 9. (a) Diagram of output intensity distribution from the 2×2 fiber array. (b) Diagram of output intensity distribution after combination with the tilled aperture in the case of the 2×2 fiber array. (c) Diagram of output intensity distribution after combination with the square fiber in the case of the 2×2 fiber array. (d) Diagram of output intensity distribution from the 3×3 fiber array. (e) Diagram of output intensity distribution after combination with the tilled aperture in the case of the 3×3 fiber array. (f) Diagram of output intensity distribution after combination with the square fiber in the case of the 3×3 fiber array.
    (a) Beam quality as a function of wavelength. (b) Beam efficiency as a function of wavelength.
    Fig. 10. (a) Beam quality as a function of wavelength. (b) Beam efficiency as a function of wavelength.
    Diagram of the comparison and data fitting of the combining efficiency of different fiber arrays.
    Fig. 11. Diagram of the comparison and data fitting of the combining efficiency of different fiber arrays.
    Diagram of the cross section of the square fiber.
    Fig. 12. Diagram of the cross section of the square fiber.
    Diagram of the experimental structure.
    Fig. 13. Diagram of the experimental structure.
    (a) Diagram of the beam spot from MFA. (b) M2 measurement of the laser beam from MFA with the 4σ method.
    Fig. 14. (a) Diagram of the beam spot from MFA. (b) M2 measurement of the laser beam from MFA with the 4σ method.
    Diagram of the side view of the splice point between the output fiber and the square core fiber.
    Fig. 15. Diagram of the side view of the splice point between the output fiber and the square core fiber.
    (a) Diagram of the beam spot at the 5.5 cm length of the square fiber. (b) Diagram of the beam spot at the 11 cm length of the square fiber. (c) M2 measurement of the laser beam at the length of 5.5 cm of the square fiber with the 4σ method.
    Fig. 16. (a) Diagram of the beam spot at the 5.5 cm length of the square fiber. (b) Diagram of the beam spot at the 11 cm length of the square fiber. (c) M2 measurement of the laser beam at the length of 5.5 cm of the square fiber with the 4σ method.
    Theoretical and experimental comparison of the self-imaging effect in the square fiber.
    Fig. 17. Theoretical and experimental comparison of the self-imaging effect in the square fiber.
    Yuefang Yan, Yu Liu, Haoyu Zhang, Yue Li, Yuwei Li, Xi Feng, Donglin Yan, Jianjun Wang, Honghuan Lin, Feng Jing, Wenhui Huang, Rumao Tao. Principle and numerical demonstration of high power all-fiber coherent beam combination based on self-imaging effect in a square core fiber[J]. Photonics Research, 2022, 10(2): 444
    Download Citation