
Yazhou Mao, Jianxi Yang, Wenjing Xu. Laser Surface Texturing Process and Its Mechanism for Brass Material[J]. Chinese Journal of Lasers, 2021, 48(10): 1002111
- Chinese Journal of Lasers
- Vol. 48, Issue 10, 1002111 (2021)
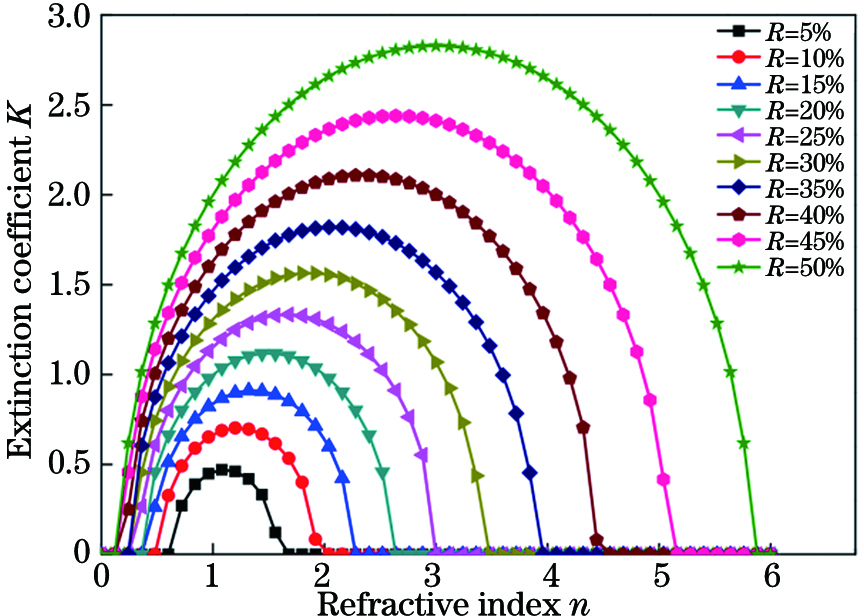
Fig. 1. Relationship between reflectivity, refractive index and extinction coefficient
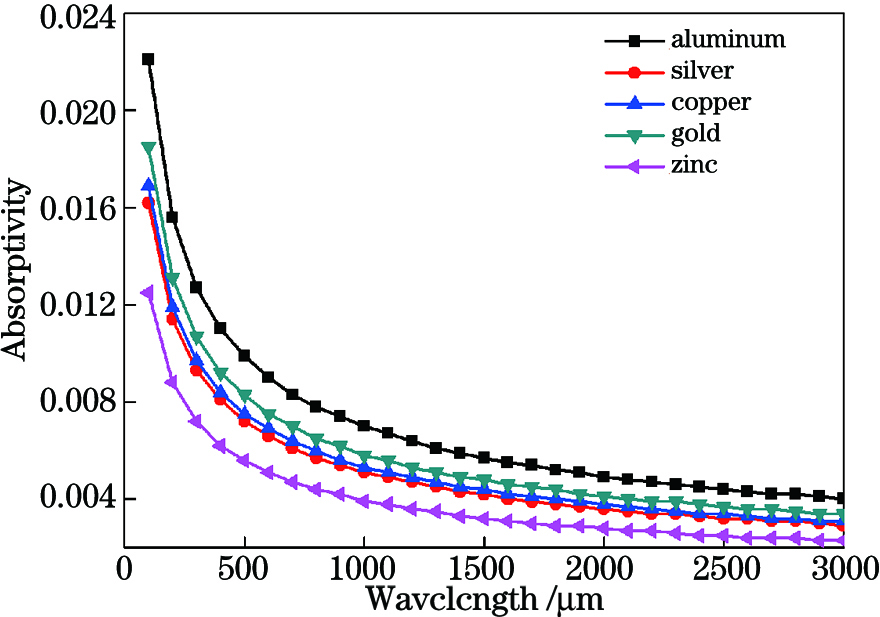
Fig. 2. Variation of absorptivity with wavelength
Fig. 3. Variation of absorptivity with temperature
Fig. 4. Millisecond laser processing model of dimple
Fig. 5. Temperature distribution of surface texturing. (a) Radial temperature distribution; (b) axial temperature distribution
Fig. 6. Temperature distribution with laser radius and time. (a) Variation of temperature with laser radius; (b) variation of temperature with time
Fig. 7. Variation of surface vapor pressure with depth
Fig. 8. Mass mobility of liquid metal under vapor pressure
Fig. 9. Variation of micropit forming efficiency with energy
Fig. 10. Thermal stress distribution. (a) Radial thermal stress distribution; (b) axial thermal stress distribution
Fig. 11. Radial circumferential thermal stress distribution. (a) Radial circumferential thermal stress under various power densities and action time; (b) radial circumferential thermal stress under various power densities and pulse widths
Fig. 12. Axial circumferential thermal stress distribution. (a) Axial circumferential thermal stress under various power densities and action time; (b) axial circumferential thermal stress under various power densities and pulse widths
Fig. 13. Effect of laser radius and action time on damage threshold. (a) Variation of damage threshold with laser beam radius; (b) variation of damage threshold with action time
Fig. 14. Morphology contour of micropit. (a) Three-dimensional topography; (b) two-dimensional morphology contour
Fig. 15. Variation of micropit diameter with energy and action time. (a) Variation of micropit diameter with energy; (b) variation of micropit diameter with action time
Fig. 16. Hardness measurement points and results. (a) Hardness meter and hardness measurement points; (b) hardness at different positions
Fig. 17. Micropit forming surface and profile. (a) Micropit forming surface; (b) micropit profile
Fig. 18. EDS analysis of micropit profile. (a) 1# region; (b) 2# region; (c) 3# region
Fig. 19. Schematic of chemical reaction change of brass material
|
Table 1. Physical properties of brass material
|
Table 2. Diameter d of micropit

Set citation alerts for the article
Please enter your email address
© Copyright 2018-2021 | Chinese Laser Press. All Rights Reserved 沪ICP备15018463号-20