
Liming Zhao, Chuan Ye, Yi Zhang, Xiaodong Xu, Jing Chen. Path Recognition Method of Robot Vision Navigation in Unstructured Environments[J]. Acta Optica Sinica, 2018, 38(8): 0815028
- Acta Optica Sinica
- Vol. 38, Issue 8, 0815028 (2018)
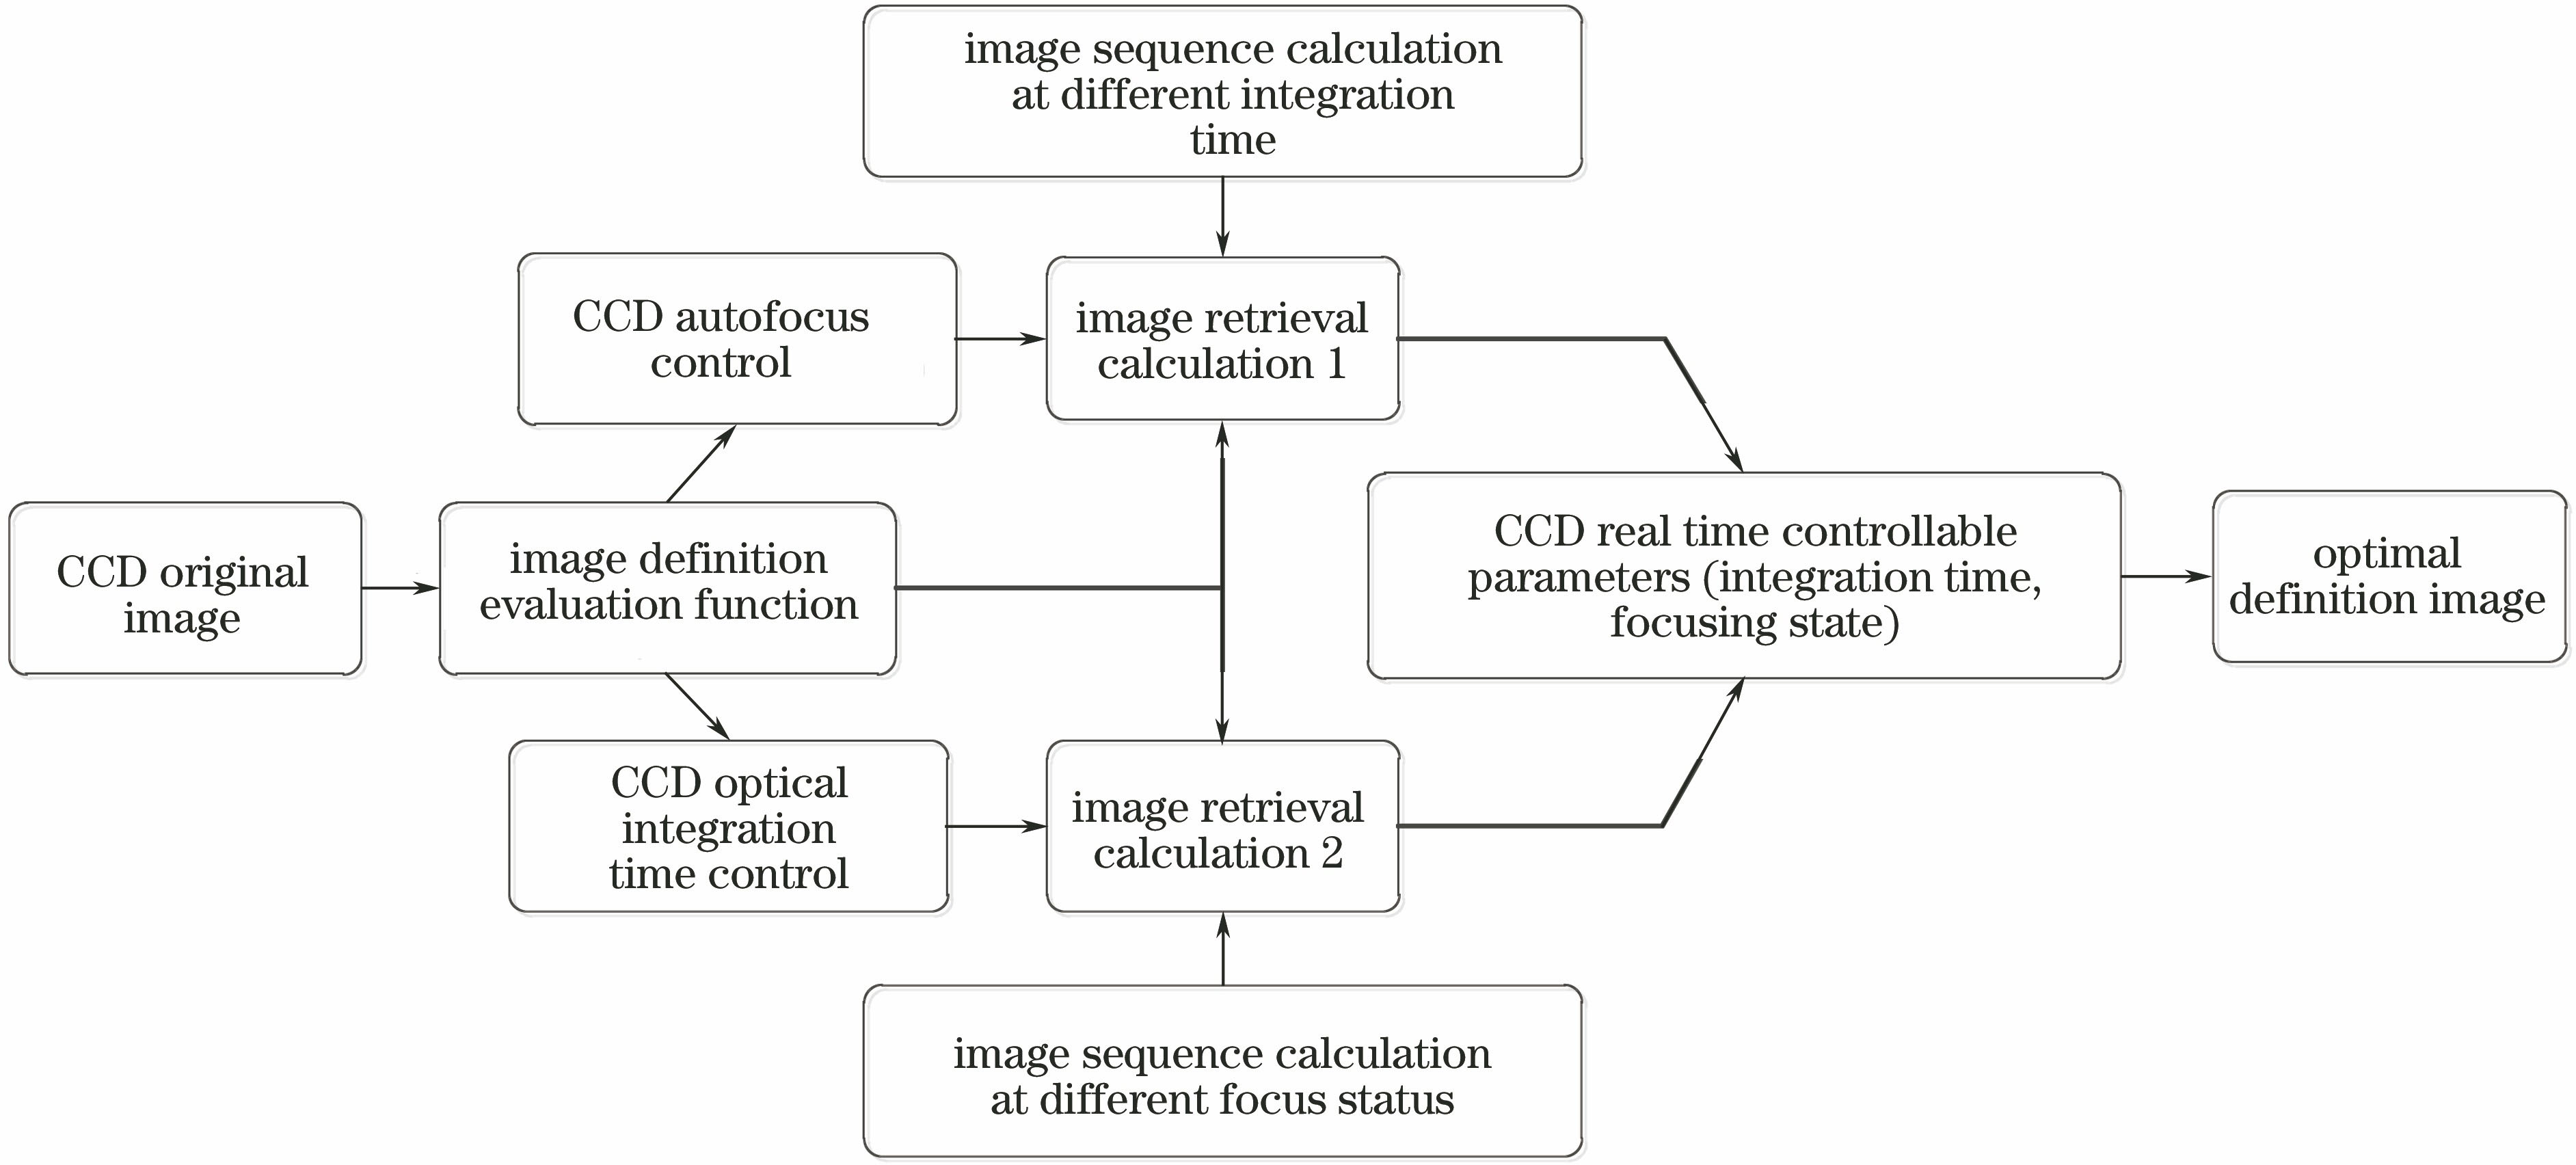
Fig. 1. Method for determining best image definition
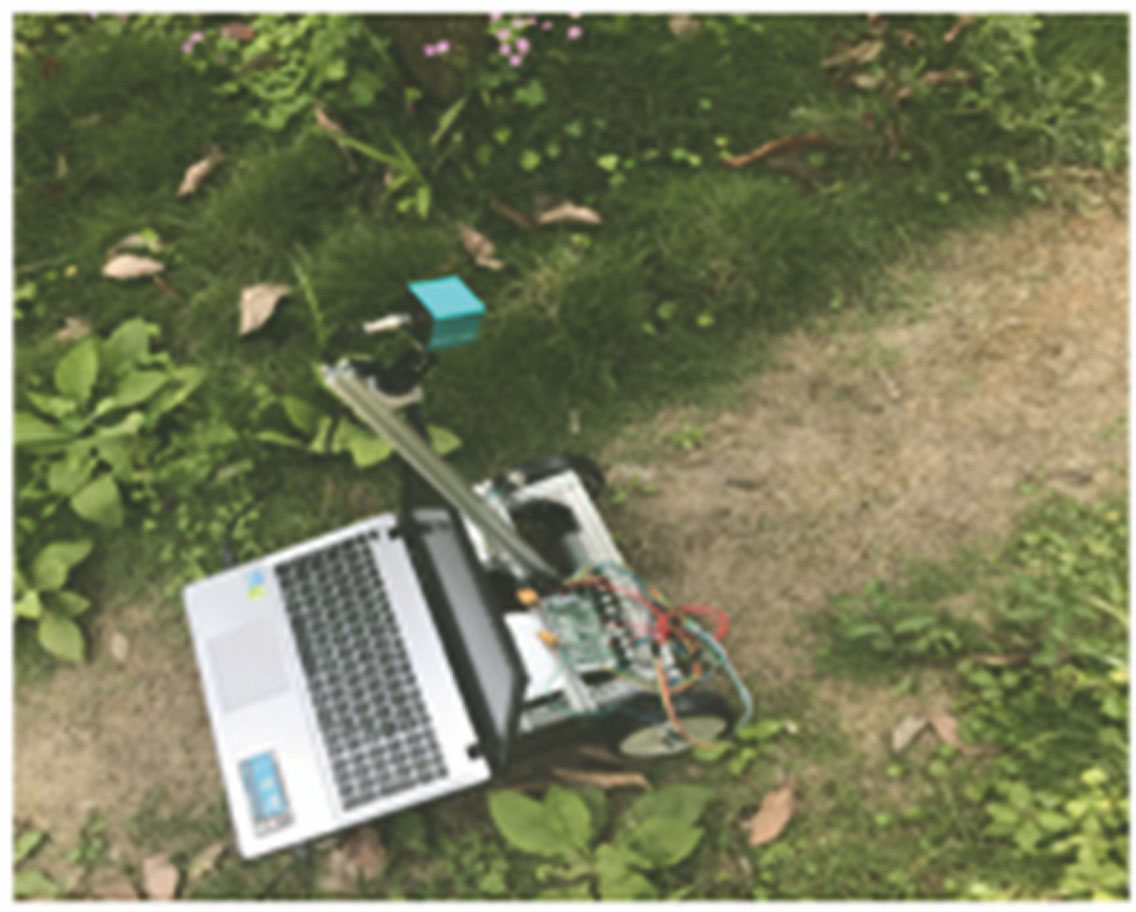
Fig. 2. Design of test platform for mobile robot visual navigation
Fig. 3. Image definition characteristics under different CCD optical integration time. (a) 5 ms; (b) 15 ms; (c) 50 ms; (d) 90 ms
Fig. 4. Image definition characteristics under different CCD defocus statuses. (a) Defocused status 1; (b) defocused status 2; (c) defocused status 3; (d) defocused status 4
Fig. 5. Response curves of best image definition under different CCD optical integration time. (a) TenenGrad; (b) average gradient; (c) information entropy
Fig. 6. Response curves of best image definition under different CCD defocus statuses. (a) TenenGrad; (b) average gradient; (c) information entropy
Fig. 7. Comparison of response results of definition calculation under different image definition evaluation functions. (a) Sequence of image definition change; (b) response results of definition evaluation functions
Fig. 8. Fuzzy connectedness between two points of a and b in α-adjacent affinity function
Fig. 9. Delineation method of target and background area based on relative fuzzy connectedness
Fig. 10. Reclassification method of pixels in undefined area of images in F-R model
Fig. 11. Flow chart of ROI detection based on fuzzy-rough set model
Fig. 12. ROI segmentation and comparison experiment of image ROI. (a) CCD high definition image; (b) original gray image; (c) result by K-means clustering algorithm(k=2); (d) result by watershed algorithm
Fig. 13. Navigation path recognition result based on F-R model. (a) Seed definition area; (b) final ROI
Fig. 14. Comparison of navigation path recognition results based on F-R model
Fig. 15. Path navigation trajectory of mobile robot. (a) Test paths; (b) robot walking control
Fig. 16. Path navigation trajectory of mobile robot.(a) Path 1; (b) path 2

Set citation alerts for the article
Please enter your email address
© Copyright 2018-2021 | Chinese Laser Press. All Rights Reserved 沪ICP备15018463号-20