• Laser & Optoelectronics Progress
  • Vol. 58, Issue 4, 0411002 (2021)
Jiaqi Liu1, Zhijie Zhang1、*, Zhenyu Lin1, and Wuliang Yin1、2
Author Affiliations
  • 1Key Laboratory of Instrumentation Science & Dynamic Measurement of Ministry of Education, North University of China, Taiyuan,Shanxi 0 38507, China;
  • 2School of Electrical and Electronic Engineering, University of Manchester, Manchester M139PL, UK
  • show less
    DOI: 10.3788/LOP202158.0411002 Cite this Article Set citation alerts
    Jiaqi Liu, Zhijie Zhang, Zhenyu Lin, Wuliang Yin. Depth Detection of Material Surface Defects Based on Laser Thermography[J]. Laser & Optoelectronics Progress, 2021, 58(4): 0411002 Copy Citation Text show less
    Schematic of laser heating
    Fig. 1. Schematic of laser heating
    Schematic of proposed system
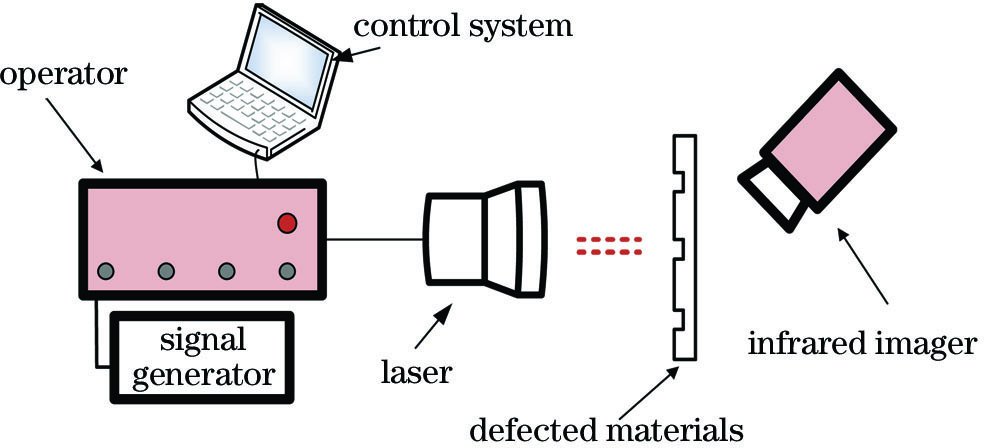
    Fig. 2. Schematic of proposed system
    Schematic of material characteristics
    Fig. 3. Schematic of material characteristics
    Infrared images of defects
    Fig. 4. Infrared images of defects
    Change of gray value at different defects. (a) No. 5 defect; (b) No. 10 defect; (c) No. 15 defect
    Fig. 5. Change of gray value at different defects. (a) No. 5 defect; (b) No. 10 defect; (c) No. 15 defect
    Relationship between temperature and defect depth
    Fig. 6. Relationship between temperature and defect depth
    Fitting curve between temperature of point B and defect depth when temperature of point A is 322.15 K
    Fig. 7. Fitting curve between temperature of point B and defect depth when temperature of point A is 322.15 K
    Defect depth /mmGray valueTemperature /K
    0.13124320.20
    0.26119317.60
    0.39117316.50
    0.52112313.70
    0.65110312.60
    0.78109312.00
    0.91108311.40
    1.04108311.40
    1.17106310.30
    1.30105309.65
    1.43103308.50
    1.56100306.70
    1.6998305.05
    1.8298305.05
    1.9596304.50
    2.0890300.85
    2.2189299.85
    2.3487298.50
    2.4783295.83
    Table 1. Change of gray value and temperature of point B
    Fitting curveFitting equationSSERMSE
    Exponential equationTB=345-26.28exp(0.25ddepth)19.791.112
    Linear equationTB=320.1-8.97ddepth23.741.18
    Quadratic equationTB =-0.93ddepth 2-6.56ddepth +31920.421.13
    Table 2. Parameters of fitting equations
    Defect depth /mm0.130.260.390.520.650.780.911.041.171.30
    e0.220.210.130.200.240.190.140.010.030.02
    Defect depth /mm1.431.561.691.721.952.082.212.342.47
    e0.010.040.040.080.090.100.020.010.05
    Table 3. Residuals between fitting equation and measured data
    Various parameters of fitting curve when temperature of A is 320.15 K
    Fitting curveFitting equationSSERMSE
    Exponential equationTB=321.7-3.81exp(0.51ddepth)4.530.53
    Linear equationTB=318.9-3.88ddepth7.940.68
    Quadratic equationTB =-0.89ddepth 2-1.56ddepth +317.94.850.55
    Various parameters of fitting curve when temperature of A is 317.15 K
    Fitting curveFitting equationSSERMSE
    Exponential equationTB=321.8-6.45exp(0.33ddepth)4.250.51
    Linear equationTB=316-3.29ddepth5.610.57
    Quadratic equationTB =-0.58ddepth 2-1.77ddepth +315.34.270.52
    Various parameters of fitting curvewhen temperature of A is 314.15 K
    Fitting curveFitting equationSSERMSE
    Exponential equationTB=317-4.33exp(0.39ddepth)3.960.49
    Linear equationTB=313.3-2.91ddepth4.210.50
    Quadratic equationTB =-0.26ddepth 2-2.23ddepth+3133.980.50
    Table 4. Parameters of fitting equations
    Jiaqi Liu, Zhijie Zhang, Zhenyu Lin, Wuliang Yin. Depth Detection of Material Surface Defects Based on Laser Thermography[J]. Laser & Optoelectronics Progress, 2021, 58(4): 0411002
    Download Citation