• Chinese Optics Letters
  • Vol. 19, Issue 12, 123602 (2021)
Tianchen Zhao1, Qiang Ma1, Yajie Bian1, Yuyi Zhang1, Yiting Liu1, Xiaolei Zhang1、2、*, Botao Wu1、**, E Wu1、2, Shitao Lou1, and Qingyuan Jin1、***
Author Affiliations
  • 1State Key Laboratory of Precision Spectroscopy, East China Normal University, Shanghai 200241, China
  • 2Collaborative Innovation Center of Extreme Optics, Shanxi University, Taiyuan 030006, China
  • show less
    DOI: 10.3788/COL202119.123602 Cite this Article Set citation alerts
    Tianchen Zhao, Qiang Ma, Yajie Bian, Yuyi Zhang, Yiting Liu, Xiaolei Zhang, Botao Wu, E Wu, Shitao Lou, Qingyuan Jin. Strong coupling with absorption and emission features of Ag@Au hollow nanoshells interacting with J-aggregated dye molecules[J]. Chinese Optics Letters, 2021, 19(12): 123602 Copy Citation Text show less
    (a) Schematic diagram of the hybrid of Ag nanoprisms and Ag@Au HNS embedded in an ensemble of J-aggregate (TDBC). (b) The structural formula of a TDBC molecule.
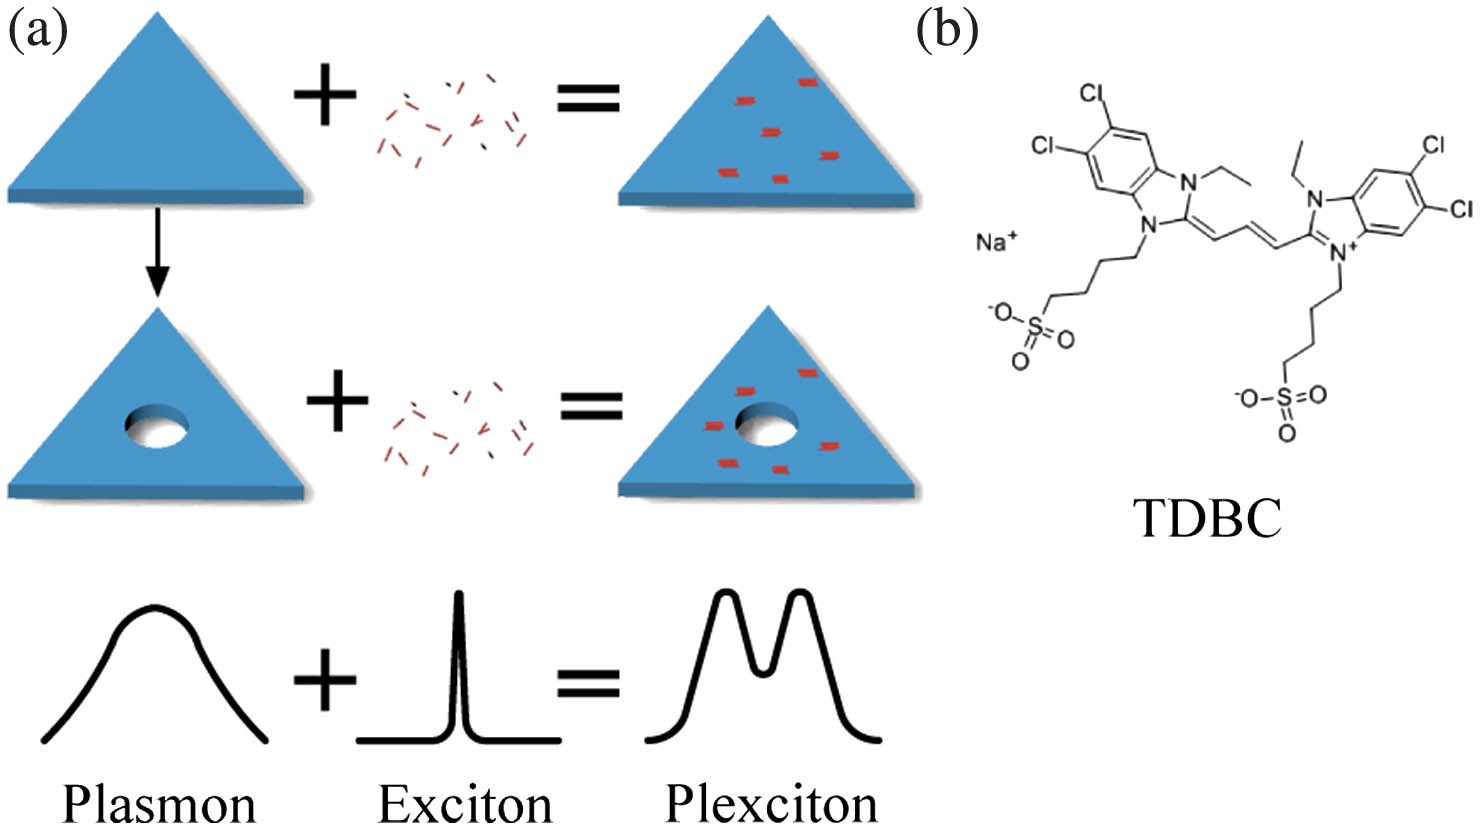
    Fig. 1. (a) Schematic diagram of the hybrid of Ag nanoprisms and Ag@Au HNS embedded in an ensemble of J-aggregate (TDBC). (b) The structural formula of a TDBC molecule.
    TEM images of (a) Ag NPs, (b) Ag@Au HNS, (c) Ag NPs/TDBC, and (d) Ag@Au HNS/TDBC. (e) and (g) Mapping of elements (distribution of Ag/Au element) of Ag NPs and Ag@Au HNS. (f) and (h) STEM images of Ag NPs and Ag@Au HNS. (i) The energy dispersive X-ray spectroscopy (EDX) analysis of Ag@Au HNS.
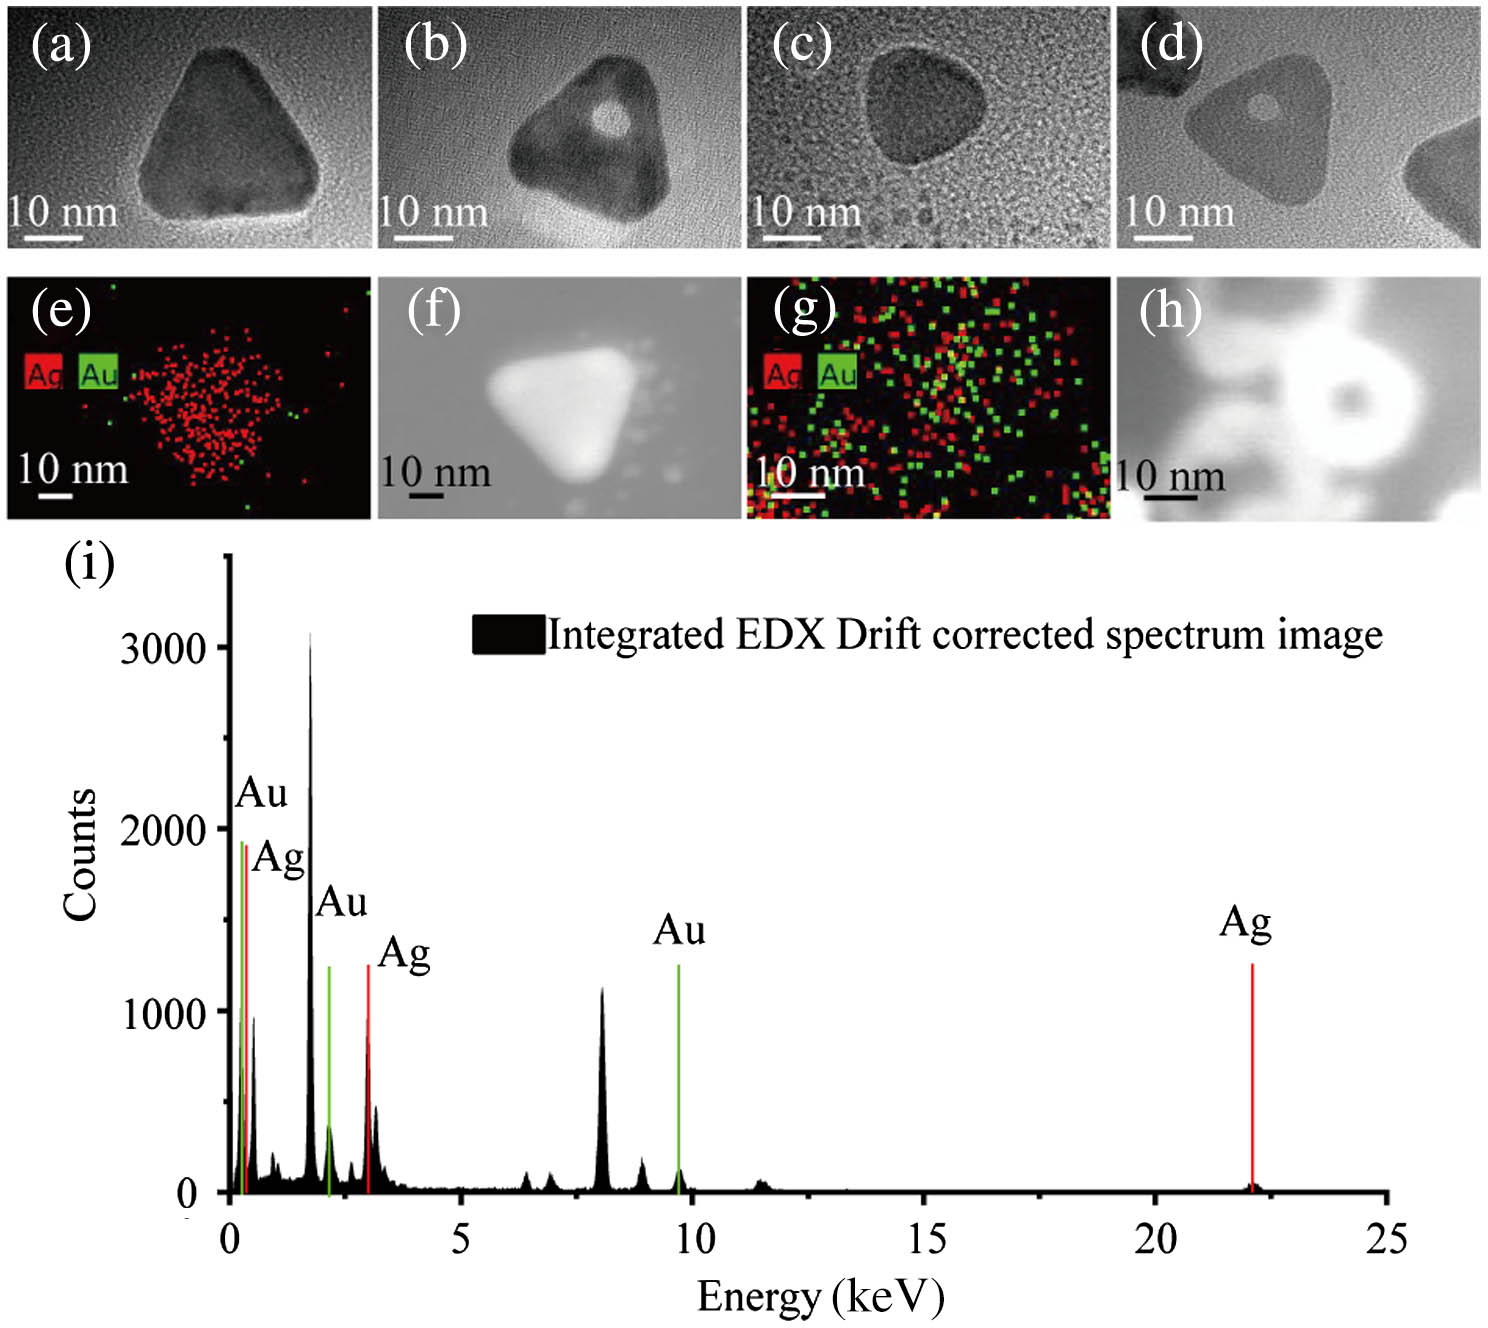
    Fig. 2. TEM images of (a) Ag NPs, (b) Ag@Au HNS, (c) Ag NPs/TDBC, and (d) Ag@Au HNS/TDBC. (e) and (g) Mapping of elements (distribution of Ag/Au element) of Ag NPs and Ag@Au HNS. (f) and (h) STEM images of Ag NPs and Ag@Au HNS. (i) The energy dispersive X-ray spectroscopy (EDX) analysis of Ag@Au HNS.
    (a) Ultraviolet-visible absorption spectrum of TDBC dye molecules. (b) Ultraviolet-visible absorption spectra of four nanostructures (black line indicates Ag NPs, red line indicates Ag@Au HNS, blue line indicates Ag NPs/TDBC, and green line indicates Ag@Au HNS/TDBC).
    Fig. 3. (a) Ultraviolet-visible absorption spectrum of TDBC dye molecules. (b) Ultraviolet-visible absorption spectra of four nanostructures (black line indicates Ag NPs, red line indicates Ag@Au HNS, blue line indicates Ag NPs/TDBC, and green line indicates Ag@Au HNS/TDBC).
    (a) Fluorescent spectra of Ag NPs/TDBC and Ag@Au HNS/TDBC. (b), (c) Temperature-dependent fluorescence intensity curves of Ag NPs/TDBC and Ag@Au HNS/TDBC measured at T = 100–300 K.
    Fig. 4. (a) Fluorescent spectra of Ag NPs/TDBC and Ag@Au HNS/TDBC. (b), (c) Temperature-dependent fluorescence intensity curves of Ag NPs/TDBC and Ag@Au HNS/TDBC measured at T = 100–300 K.
    Electric field (|E/E0|) distribution images for the (a) pure Ag individual NP with LSPR peak at 565 nm, (b) TDBC-doped Ag NPs ensemble with LSPR peak at the upper branch (ω+) maximum (544 nm), (c) TDBC-doped Ag NPs ensemble with LSPR peak at the minimum (577 nm), (d) J-aggregate-doped Ag NPs ensemble with LSPR peak at the lower branch (ω−) maximum (607 nm), (e) Ag@Au HNS individual nanoparticle with LSPR peak at 589 nm, (f) TDBC-doped Ag@Au HNS ensemble with LSPR peak at the upper branch (ω+) maximum (559 nm), (g) TDBC-doped Ag@Au HNS ensemble with LSPR peak at the minimum (583 nm), and (h) J-aggregate-doped Ag@Au HNS ensemble with LSPR peak at the lower branch (ω−) maximum (612 nm). (i) Simulation extinction spectra of four nanostructures (black line indicates Ag NPs, red line indicates Ag@Au HNS, blue line indicates Ag NPs/TDBC, and green line indicates Ag@Au HNS/TDBC).
    Fig. 5. Electric field (|E/E0|) distribution images for the (a) pure Ag individual NP with LSPR peak at 565 nm, (b) TDBC-doped Ag NPs ensemble with LSPR peak at the upper branch (ω+) maximum (544 nm), (c) TDBC-doped Ag NPs ensemble with LSPR peak at the minimum (577 nm), (d) J-aggregate-doped Ag NPs ensemble with LSPR peak at the lower branch (ω) maximum (607 nm), (e) Ag@Au HNS individual nanoparticle with LSPR peak at 589 nm, (f) TDBC-doped Ag@Au HNS ensemble with LSPR peak at the upper branch (ω+) maximum (559 nm), (g) TDBC-doped Ag@Au HNS ensemble with LSPR peak at the minimum (583 nm), and (h) J-aggregate-doped Ag@Au HNS ensemble with LSPR peak at the lower branch (ω) maximum (612 nm). (i) Simulation extinction spectra of four nanostructures (black line indicates Ag NPs, red line indicates Ag@Au HNS, blue line indicates Ag NPs/TDBC, and green line indicates Ag@Au HNS/TDBC).
    ElementWeight (%)Atomic Fraction (%)
    Ag73.5683.55
    Au26.4416.45
    Table 1. EDX Spectrum Analysis of Ag@Au Hollow Nanostructure
    Tianchen Zhao, Qiang Ma, Yajie Bian, Yuyi Zhang, Yiting Liu, Xiaolei Zhang, Botao Wu, E Wu, Shitao Lou, Qingyuan Jin. Strong coupling with absorption and emission features of Ag@Au hollow nanoshells interacting with J-aggregated dye molecules[J]. Chinese Optics Letters, 2021, 19(12): 123602
    Download Citation