Juan LIU1,1,1,1, Xiaojun YAO1,1,1,1,1,1,1,1,*, Shiyin LIU1,1,1,1,1,1,1,1, Wanqin GUO1,1,1,1, and Junli XU1,1,1,1
Author Affiliations
11College of Geography and Environmental Science, Northwest Normal University, Lanzhou 730070, China12State Key Laboratory of Cryosphere Sciences, Northwest Institute of Eco-Environment and Resources, CAS, Lanzhou 730000, China13Institute of International Rivers and Eco-Security, Yunnan University, Kunming 650091, China14Yancheng Teachers University, Yancheng 224051, Jiangsu, Chinashow less
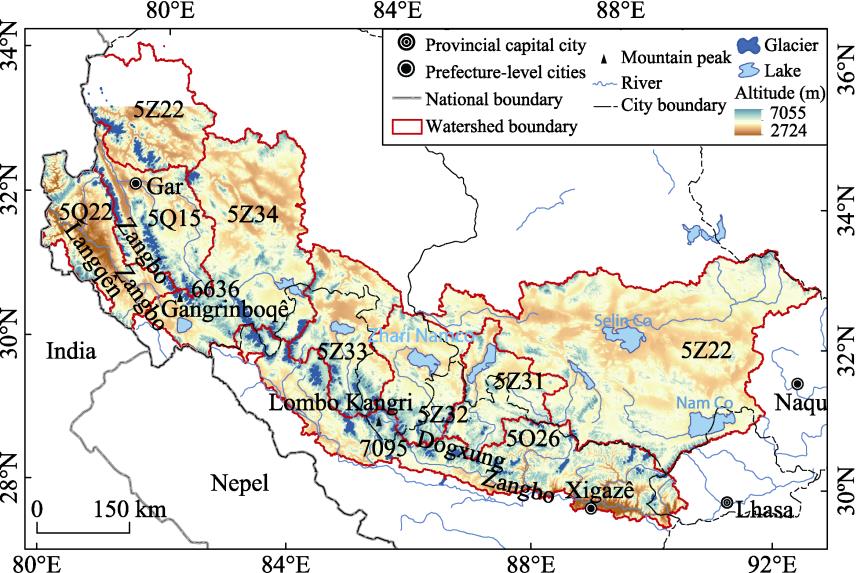
Fig. 1. Distribution of glaciers in the Gangdisê Mountains
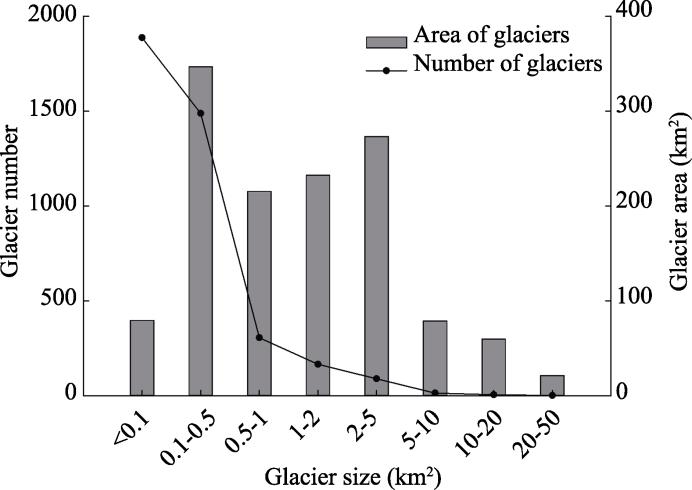
Fig. 2. Number and area of glaciers with different sizes in the Gangdisê Mountains from 2015-2016
Fig. 3. Changes in the number and area of glaciers with different sizes in the Gangdisê Mountains from 1970 to 2016
Fig. 4. Altitude characteristics of changes in glacier area in the Gangdisê Mountains from 1970 to 2016
Fig. 5. Orientational characteristics of glacial changes in the Gangdisê Mountains from 1970 to 2016
Fig. 6. Changes in glacier area in different sections of the Gangdisê Mountains from 1970 to 2016
Fig. 7. Average temperature during the ablation period and annual precipitation in the Gangdisê Mountains from 1970 to 2016
| Number | Orbit number | Acquisition date | Number | Orbit number | Acquisition date |
|---|
| Path | Row | Path | Row |
|---|
| 1 | 138 | 39 | 2016-04-27 | 8 | 143 | 38 | 2016-10-07 | | 2 | 138 | 40 | 2016-04-27 | 9 | 143 | 39 | 2016-09-05 | | 3 | 139 | 39 | 2016-03-17 | 10 | 144 | 38 | 2016-06-24 | | 4 | 140 | 39 | 2016-10-18 | 11 | 145 | 37 | 2016-10-15 | | 5 | 141 | 39 | 2016-05-18 | 12 | 145 | 38 | 2016-09-03 | | 6 | 141 | 40 | 2015-10-07 | 13 | 146 | 37 | 2016-09-10 | | 7 | 142 | 39 | 2015-09-28 | | | | |
|
Table 1. Landsat OLI images used to obtain glacier data in the Gangdisê Mountains from 2015-2016
| Basin (code) | Secondary basin(code) | Tertiary basin(code) | Number | Area | Volume |
|---|
| (%) | (km2) | (%) | (km2) | (%) |
|---|
| Ganges River (5O) | Yarlung Zangbo River (5O2) | Dogxung Zangbo (5O26) | 1372 | 34.71 | 413.65 | 31.66 | 16.63 | 28.65 | | Indus River(5Q) | Sênggê Zangbo (5Q1) | Sênggê Zangbo (5Q15) | 703 | 17.78 | 172.36 | 13.19 | 7.54 | 12.99 | | Langqên Zangbo (5Q2) | Langqên Zangbo (5Q22) | 227 | 5.74 | 40.09 | 3.07 | 1.30 | 2.24 | | Total | 930 | 23.52 | 212.45 | 16.26 | 8.84 | 15.23 | | Tibetan Plateau interior(5Z) | Selin Co (5Z2) | Selin Co (5Z22) | 43 | 1.09 | 15.46 | 1.18 | 0.66 | 1.14 | | Zhari Namco (5Z3) | Dangta Yumco (5Z31) | 104 | 2.63 | 27.28 | 2.09 | 0.93 | 1.60 | | Zhari Namco (5Z32) | 182 | 4.61 | 61.48 | 4.71 | 2.52 | 4.34 | | Taro Co (5Z33) | 301 | 7.61 | 157.64 | 12.07 | 6.80 | 11.71 | | Ngangla Ring Co (5Z34) | 531 | 13.43 | 343.12 | 26.26 | 19.47 | 33.54 | | Bangong Co (5Z4) | Bangong Co (5Z42) | 490 | 12.40 | 75.37 | 5.77 | 2.20 | 3.79 | | Total | 1651 | 41.78 | 680.35 | 52.08 | 29.72 | 51.19 |
|
Table 2. Glacier statistics for different basins in the Gangdisê Mountains from 2015-2016
| City (region) | Number | Area | Volume |
|---|
| (%) | (km2) | (%) | (km3) | (%) |
|---|
| Lhasa | 46 | 1.17 | 22.83 | 1.75 | 1.13 | 1.94 | | Xigazê | 1603 | 40.55 | 607.87 | 46.53 | 27.09 | 46.58 | | Ngari | 2260 | 57.17 | 665.13 | 50.91 | 29.60 | 50.89 | | Naqu | 44 | 1.11 | 10.62 | 0.81 | 0.34 | 0.58 |
|
Table 3. Glacier statistics in different administrative divisions in the Gangdisê Mountains from 2015-2016
| Name | Time period | Area change(km2) | Relative rate of glacier area change (%·a-1) | Data source |
|---|
| Altay Mountains | 1960-2009 | -104.61 | -0.94 | Yao et al., 2012 | | Tianshan Mountains | 1959-2010 | -1619.82 | -0.40 | Xing et al., 2017 | | A°Nyêmaqên Mountains | 1966-2000 | -21.70 | -0.56 | Liu et al., 2002 | | Altun Mountains | 1973-2010 | -54.22 | -0.46 | Zhu et al., 2013 | | Qilian Mountains | 1956-2010 | -417.15 | -0.43 | Sun et al., 2018 | | Middle section of the Tanggula Mountains | 1990-2015 | -115.46 | -1.00 | Wang et al., 2016 | | Central and Western Qangtang Plateau | 1970-2000 | -5.07 | -0.03 | Li et al., 2009 | | Gangdisê Mountains | 1970-2016 | -854.05 | -1.09 | This study | | Western region of the Nyainqetanglha Range | 1970-2000 | -52.10 | -0.19 | Shangguan et al., 2008 | | Kangri Karpo Mountains | 1980-2015 | -679.50 | -0.82 | Wu et al., 2018 | | Luozha region, Eastern Himalayas | 1980-2007 | -80.77 | -0.66 | Li et al., 2011 | | Gongga Mountain | 1974-2010 | -30.20 | -0.35 | Li et al., 2013 |
|
Table 4. Statistics of glacier changes in western China in recent decades