
Juan LIU, Xiaojun YAO, Shiyin LIU, Wanqin GUO, Junli XU. Glacial changes in the Gangdisê Mountains from 1970 to 2016[J]. Journal of Geographical Sciences, 2020, 30(1): 131
- Journal of Geographical Sciences
- Vol. 30, Issue 1, 131 (2020)
Abstract
1 Introduction
Glaciers are important components of the cryosphere (
Due to its large area of well-developed modern and Quaternary glaciers, the Tibetan Plateau was known as the third pole of the world (
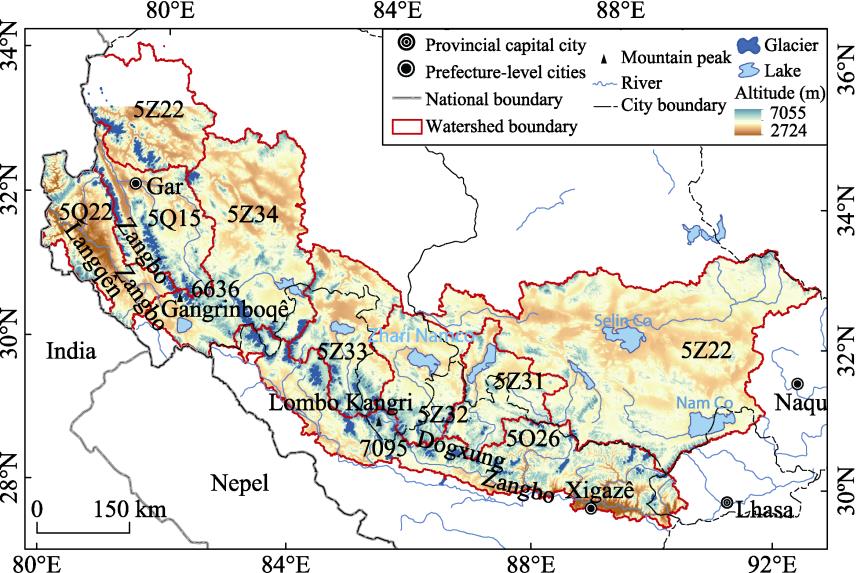
2 Study area
The Gangdisê Mountains (29°14°-33°42°N, 78°52°-90°03°E) extend across the southeastern part of the Tibet Autonomous Region (
While the modern glaciers in the Gangdisê Mountains are small and mainly concentrated in the alpine areas, the ancient glaciers are huge (
![]()
Figure 1.
3 Data and methods
3.1 Data
The data sources for the FCGI dataset of the Gangdisê Mountains were topographic maps based on aerial photogrammetry from 1970 to 1980 (33 topographic maps at a scale of 1:50,000 and 56 maps at a scale of 1:100,000). These topographic maps were concentrated in three periods: 1970-1972, 1974, and 1980. The number of topographic maps corresponding to 1970 accounted for more than half of the total number of maps. In the FCGI dataset, the glacier area in this period accounts for 65.67% of the total area. Therefore, this study used the FCGI data for 1970. The data sources for the SCGI dataset were 20 Landsat TM/ETM+ remote sensing images with little cloud or snow cover. The data sources of the 2015-2016 glacier dataset were 13 Landsat OLI remote sensing images (11 were collected in 2016 and 2 in 2015;
| Number | Orbit number | Acquisition date | Number | Orbit number | Acquisition date | |||
|---|---|---|---|---|---|---|---|---|
| Path | Row | Path | Row | |||||
| 1 | 138 | 39 | 2016-04-27 | 8 | 143 | 38 | 2016-10-07 | |
| 2 | 138 | 40 | 2016-04-27 | 9 | 143 | 39 | 2016-09-05 | |
| 3 | 139 | 39 | 2016-03-17 | 10 | 144 | 38 | 2016-06-24 | |
| 4 | 140 | 39 | 2016-10-18 | 11 | 145 | 37 | 2016-10-15 | |
| 5 | 141 | 39 | 2016-05-18 | 12 | 145 | 38 | 2016-09-03 | |
| 6 | 141 | 40 | 2015-10-07 | 13 | 146 | 37 | 2016-09-10 | |
| 7 | 142 | 39 | 2015-09-28 | |||||
Table 1.
Landsat OLI images used to obtain glacier data in the Gangdisê Mountains from 2015-2016
The digital elevation model (DEM) data used in the FCGI and SCGI datasets in the Gangdisê Mountains were topographic maps and SRTM V4.1 data, respectively (
3.2 Methods
Studies have shown that the FCGI dataset contains some errors, such as incorrect boundary mapping of glaciers, small glaciers being missed, and seasonal snow spots being wrongly interpreted as glaciers (
where ε is the error (km2); N is the perimeter of the glacier boundary; and A is the length of half a pixel (which are 15 m for Landsat TM/ETM+/OLI images). The calculated errors in glacier area in the SCGI and 2016 glacier datasets for the Gangdisê Mountains resulting from image spatial resolution were ±122.97 km2 (±8.29%) and ±116.89 km2 (±8.95%), respectively.Glacier ice volume is an important indicator of global sea level rise (
where V (km3) is the ice volume of a glacier with surface area A (km2); and c and γ are empirical coefficients. In this study, the glacier ice volume in the Gangdisê Mountains was calculated by the numerical methods proposed by Radić and Hock (2010), Grinsted (2013), and Liu et al. (2003), and the average values obtained from the above three methods were determined (
4 Results
4.1 The contemporary glaciers in the Gangdisê Mountains
4.1.1 General glacier characteristics in the Gangdisê MountainsIn 2015-2016, there were 3953 glaciers with a total area of 1306.45 km2 and ice volume of 58.16 km3 in the Gangdisê Mountains. As shown in
![]()
Figure 2.
4.1.2 Distributions of glaciers in different drainage systems
As described in Section 2, glaciers in the Gangdisê Mountains were assigned to three drainage basins: 5O, 5Q, and 5Z.
| Basin (code) | Secondary basin | Tertiary basin | Number | Area | Volume | |||
|---|---|---|---|---|---|---|---|---|
| (%) | (km2) | (%) | (km2) | (%) | ||||
| Ganges River (5O) | Yarlung Zangbo | Dogxung Zangbo | 1372 | 34.71 | 413.65 | 31.66 | 16.63 | 28.65 |
| Indus River | Sênggê Zangbo | Sênggê Zangbo | 703 | 17.78 | 172.36 | 13.19 | 7.54 | 12.99 |
| Langqên Zangbo | Langqên Zangbo | 227 | 5.74 | 40.09 | 3.07 | 1.30 | 2.24 | |
| Total | 930 | 23.52 | 212.45 | 16.26 | 8.84 | 15.23 | ||
| Tibetan Plateau interior | Selin Co (5Z2) | Selin Co (5Z22) | 43 | 1.09 | 15.46 | 1.18 | 0.66 | 1.14 |
| Zhari Namco (5Z3) | Dangta Yumco (5Z31) | 104 | 2.63 | 27.28 | 2.09 | 0.93 | 1.60 | |
| Zhari Namco (5Z32) | 182 | 4.61 | 61.48 | 4.71 | 2.52 | 4.34 | ||
| Taro Co (5Z33) | 301 | 7.61 | 157.64 | 12.07 | 6.80 | 11.71 | ||
| Ngangla Ring | 531 | 13.43 | 343.12 | 26.26 | 19.47 | 33.54 | ||
| Bangong Co (5Z4) | Bangong Co (5Z42) | 490 | 12.40 | 75.37 | 5.77 | 2.20 | 3.79 | |
| Total | 1651 | 41.78 | 680.35 | 52.08 | 29.72 | 51.19 | ||
Table 2.
Glacier statistics for different basins in the Gangdisê Mountains from 2015-2016
4.1.3 Distributions of glaciers in different administrative divisions
In terms of administrative divisions, glaciers in the Gangdisê Mountains were located within the cities (regions) of Lhasa, Xigazê, Ngari and Naqu in the Tibet Autonomous Region (
| City (region) | Number | Area | Volume | |||
|---|---|---|---|---|---|---|
| (%) | (km2) | (%) | (km3) | (%) | ||
| Lhasa | 46 | 1.17 | 22.83 | 1.75 | 1.13 | 1.94 |
| Xigazê | 1603 | 40.55 | 607.87 | 46.53 | 27.09 | 46.58 |
| Ngari | 2260 | 57.17 | 665.13 | 50.91 | 29.60 | 50.89 |
| Naqu | 44 | 1.11 | 10.62 | 0.81 | 0.34 | 0.58 |
Table 3.
Glacier statistics in different administrative divisions in the Gangdisê Mountains from 2015-2016
4.2 Glacier changes in the Gangdisê Mountains from 1970 to 2016
4.2.1 Changes of glacier number, area and ice volume
When checking the FCGI dataset of the Gangdisê Mountains, there were 436 glaciers (with an area of 244.97 km2), that were not in the original FCGI dataset accounting for 11.34% of the total area. After revision, there were 4654 glaciers in the Gangdisê Mountains with a total area of 2160.50 km2 (average area of 0.46 km2 and ice volume of 96.06 km3). In the revised SCGI dataset for the Gangdisê Mountains, there were 4207 glaciers with a total area of 1483.28 km2 (average area of 0.35 km2 and ice volume of 66.01 km3). Thus, 313 glaciers with an area of 187.01 km2 were not contained in the original SCGI dataset.
The statistics from the FCGI and SCGI datasets indicated that the glacial area in the Gangdisê Mountains decreased by 677.22 km2 (-31.35%) from 1970 to 2009. The relative rate of glacier area change was 0.96%·a-1, and the loss of ice volume was 30.05 km3 (-0.77 km3/a). In total, 914 glaciers with a total area of 106.52 km2 disappeared completely. An additional 171 glaciers decreased in area from 142.26 km2 to 80.99 km2 and split into 375 smaller glaciers. From 2009 to 2016, the number of glaciers in the Gangdisê Mountains decreased by 254 (-6.04%), with 298 glaciers (with an area of 11.93 km2) disappeared completely; an additional 25 glaciers split into 53 smaller glaciers and decreased in area from 8.08 km2 to 4.81 km2. In the past seven years, the area of glaciers in the Gangdisê Mountains decreased by 176.83 km2 (-11.92%), the relative rate of glacier area change was 1.78%·a-1, and the loss of ice volume was 7.85 km3 (-1.12 km3/a). The number of glaciers in the Gangdisê Mountains decreased by 701 (-15.06%), the glacier area decreased by 854.05 km2 (-39.53%), the relative rate of glacier area change was 1.09%·a-1, and the loss of ice volume was approximately 37.90 km3. The loss rates were -0.82 km3/a and -0.86%·a-1. Obviously, the number, area, and ice volume of glaciers in the Gangdisê Mountains decreased from 1970 to 2009 and from 2009 to 2016; however, the extents of the decreases in glacier area and ice volume were greater from 2009-2016 compared to those from 1970-2016.
As shown in
The decreases in glacier area for glaciers with sizes of 1-2 km2, 2-5 km2, and 5-10 km2 ranged from -163.40 km2 to -121.53 km2. The numbers of glaciers with sizes of 10-20 km2 and 20-50 km2 remained unchanged from 1970 to 2016, and glaciers with sizes of 20-50 km2 experienced the smallest decrease in area (-2.06 km2) among all glacier size groups. The relative rate of glacier area change was calculated for glaciers with different sizes, indicated that the retreat rate with decreasing glacier size. Specifically, small glaciers (<0.1 km2) retreated the fastest (-3.88%·a-1) followed by glaciers with an area of 0.1-0.5 km2 (-2.03%·a-1) and an area of 0.5-1 km2 (-1.28%·a-1). The relative rates of change in glacier area for glaciers with sizes of 1-10 km2 was between -0.88%·a-1 and -0.42%·a-1, rates of glacier retreat for glaciers with sizes of 10-20 km2 and >20 km2 were basically equivalent (-0.18%·a-1 and -0.20%·a-1, respectively).
![]()
Figure 3.
4.2.2 Changes in glacier altitude
The main topographical factors affecting the number and size of glaciers were the absolute elevation of the host mountain and the relative elevation above the equilibrium line (
![]()
Figure 4.
4.2.3 Orientation characteristics of glacial changes
Glacier orientation refers to the direction that a glacier faces, and is usually determined with respect to the eight azimuths: north, northeast, east, southeast, south, southwest, west and northwest (
![]()
Figure 5.
4.2.4 Regional differences in glacier change
The Gangdisê Mountains are long and narrow and can be divided into three parts: western (west of the Saga-Coqên Highway), middle (from the Saga-Coqên Highway to the China-Nepal Highway), and eastern (east of the China-Nepal Highway) (
![]()
Figure 6.
5 Discussion
5.1 Response of glaciers to climate change
Precipitation and temperature along with their combination are the main climatic factors affecting glacial development. Precipitation determines the accumulation of glaciers, temperature determines the melting of glaciers, and their combination determines the nature, development, and evolution of glaciers (
The strong retreat of glaciers in the Gangdisê Mountains was not only affected by regional temperature and precipitation, but also by the average glacier size. The Gangdisê Mountains are characterized by high altitude, steep and broken terrain, and abundant small glaciers. According to the SCGI dataset, the average glacier area in the Gangdisê Mountains is small (
![]()
Figure 7.
5.2 Comparison with glacier changes in typical mountainous areas in western China
Previous studies have shown that glaciers in western China are generally retreating. Due to differences in the data sources used and study periods considered in different studies along with different glacier resources in different mountain ranges, the rate of change in glacier area (change in glacier area/time interval) cannot truly reflect glacier retreat. To facilitate comparison, we used the method proposed by Sun et al. (2018) to calculate the relative rate of glacier area change and compared the values for different mountains in western China (
| Name | Time | Area change | Relative rate of glacier area change (%·a-1) | Data source | |
|---|---|---|---|---|---|
| Altay Mountains | 1960-2009 | -104.61 | -0.94 | Yao | |
| Tianshan Mountains | 1959-2010 | -1619.82 | -0.40 | Xing | |
| A°Nyêmaqên Mountains | 1966-2000 | -21.70 | -0.56 | Liu | |
| Altun Mountains | 1973-2010 | -54.22 | -0.46 | Zhu | |
| Qilian Mountains | 1956-2010 | -417.15 | -0.43 | Sun | |
| Middle section of the Tanggula Mountains | 1990-2015 | -115.46 | -1.00 | Wang | |
| Central and Western Qangtang Plateau | 1970-2000 | -5.07 | -0.03 | Li | |
| Gangdisê Mountains | 1970-2016 | -854.05 | -1.09 | This study | |
| Western region of the Nyainqetanglha Range | 1970-2000 | -52.10 | -0.19 | Shangguan | |
| Kangri Karpo Mountains | 1980-2015 | -679.50 | -0.82 | Wu | |
| Luozha region, Eastern Himalayas | 1980-2007 | -80.77 | -0.66 | Li | |
| Gongga Mountain | 1974-2010 | -30.20 | -0.35 | Li | |
Table 4.
Statistics of glacier changes in western China in recent decades
6 Conclusions
(1) The revised FCGI dataset for the Gangdisê Mountains revealed 4654 glaciers with an area of 2160.50 km2 and an ice volume of approximately 96.06 km3. After supplementing with the SCGI dataset, there were 4207 glaciers with an area of 1483.28 km2 and an ice volume of 66.01 km3. In total, 3953 glaciers with an area of 1306.45 km2 and an ice volume of 58.16 km3 were identified in the Gangdisê Mountains from 2015 to 2016. Among glaciers with different sizes, the glaciers with sizes of 0.1-5 km2 had the largest area, while glaciers with sizes <0.5 km2 had the largest number.
(2) Among the regions in the Gangdisê Mountains, the Tibetan Plateau interior had the largest number, area, and volume of glaciers, followed by the Ganges River basin and the Indus River basin. Among tertiary basins, the area and number of glaciers were the largest in Dogxung Zangbo basin, while the average area and ice volume were the largest in the Ngangla Ringco basin. The Selin Co basin had the least glacier resources, and the average glacier size was the smallest in the Bangong Co basin.
(3) In the past 50 years, the area of glaciers in the Gangdisê Mountains decreased by 854.05 km2 (-39.53%). The decrease in glacier area was mainly concentrated at altitudes of 5600-6100 m, while no change in glacier area was observed at elevations above 6500 m. The middle altitude of glacier area increased from 5895.2 to 5936.5 m from 1970 to 2016. Among glacier orientations, north-oriented glaciers suffered the largest area loss (-431.03 km2), while northwest-oriented glaciers experienced the largest percentage change in glacier area (-70.31%). West-oriented glaciers had the smallest loss in area (-33.53%).
(4) Compared to other mountains in western China, the Gangdisê Mountains experienced the strongest glacial retreat, and the recession has accelerated in recent years. During the study period, the rate of glacier retreat increased from west to east in the Gangdisê Mountains. The relative rate of glacier change was the highest in the eastern section of the Gangdisê Mountains (-1.72%·a-1), followed by the middle section (-1.67%·a-1) and the western section (-0.83%·a-1). Under the background of climate warming, the increased temperature during the ablation period was the most important cause for glacier retreat in the study area.
References
[1] J BeedleM, B Menounos, R Wheate et al. Glacier change in the Cariboo Mountains, British Columbia, Canada (1952-2005). Cryosphere, 9, 65-80(2014).
[2] I Benn D, T Bolch, K Hands et al. Response of debris-covered glaciers in the Mount Everest region to recent warming, and implications for outburst flood hazards. Earth-Science Reviews, 114, 156-174(2012).
[3] A Church J, J White N, F Konikow L et al. Revisiting the Earth’s sea-level and energy budgets from 1961 to 2008. Geophysical Research Letters, 40, 4066-4066(2013).
[4] Q Gao X. Discussion on the relationship between glacial fluctuation and climate change. Plateau Meteorology, 19, 9-16(2000).
[5] J Gardelle, E Berthier, Y Arnaud. Slight mass gain of Karakoaram glaciers in the early twenty-first century. Nature Geoscience, 5, 322-325(2012).
[6] E Berthier, Y Arnaud et al. Region-wide glacier mass balances over the Pamir-Karakoram-Himalaya during 1999-2011. Cryosphere, 9, 557-564(2013).
[7] W Guo, S Liu, J Xu et al. The second Chinese glacier inventory: Data, methods and results. Journal of Glaciology, 61, 357-372(2015).
[8] K Hall D, J Bayr K, W Schnöer et al. Consideration of the errors inherent in mapping historical glacier positions in Austria from ground and space (1893-2001). Remote Sensing of Environment, 86, 566-577(2003).
[9] W Immerzeel W, P Van Beek L, F Bierkens M. Climate change will affect the Asian water towers. Science, 328, 1382-1385(2010).
[10] A Kääb, D Treichler, C Nuth et al. Brief communication: Contending estimates of 2003-2008 glacier mass balance over the Pamir-Karakoram-Himalaya. Cryosphere, 7, 1263-1286(2015).
[11] C Kang S, F Chen, H Ye Q et al. Glacier retreating dramatically on the Mt. Nyainqentaglha during the last 40 years. Journal of Glaciology and Geocryology, 29, 863-873(2007).
[12] S Kargel J, J Leonard G, P Bishop M et al. Global Land Ice Measurements from Space. Heidelberg:. Springer.(2014).
[13] P Li D, P Wang L, Y Liu S et al. Tupu analysis of the spatio-temporal glacier variations in the central and western Qangtang Plateau since the Little Ice Age. Journal of Glaciology and Geocryology, 31, 40-47(2009).
[14] J Li J, X Zheng B, J Yang X et al. Tibet Glacier.(1986).
[15] X Li, B Yang T, Z Tian H et al. Response of glacier in Gongga Mountain to climate change during the last 40 years. Research of Soil and Water Conservation, 20, 125-129(2013).
[16] G Li Z, D Yao T, H Ye Q et al. Monitoring glacial variations based on remote sensing in the Luozha region, eastern Himalayas, 1980-2007. Geographical Research, 30, 939-953(2011).
[17] Y Liu S, J Ding Y, J Li et al. Glaciers in response to recent climate warming in western China. Quaternary Sciences, 26, 762-771(2006).
[18] Y Liu S, X Lu A, J Ding Y et al. Glacier fluctuations and the inferred climate changes in the A’Nyêmaqên Mountains in the source area of the Yellow River. Journal of Glaciology and Geocryology, 24, 701-707(2002).
[19] Y Liu S, H Shangguan D, J Ding Y et al. Glacier variations since the early 20th century in the Gangrigabu Range, southeast Tibetan Plateau. Journal of Glaciology and Geocryology, 27, 55-63(2005).
[20] Y Liu S, J Yao X, Q Guo W et al. The contemporary glaciers in China based on the Second Chinese Glacier Inventory. Journal of Geographical Sciences, 70, 3-16(2015).
[21] W Liu, H Guo Q, X Wang Y. Temporal-spatial climate change in the last 35 years in Tibet and its geo-environmental consequences. Environmental Geology, 54, 1747-1754(2008).
[22] J Oerlemans. Quantifying global warming from the retreat of glaciers. Science, 264, 243-244(1994).
[23] J Oerlemans. Extracting a climate signal from 169 glacier records. Science, 308, 675-677(2005).
[24] C Pu J, D Yao T, L Wang N et al. Fluctuations of the glaciers on the Tibetan Plateau during the past century. Journal of Glaciology and Geocryology, 26, 517-522(2004).
[25] J Qiu. China: The third pole. Nature, 454, 393-396(2008).
[26] H Shangguan D. Glacier changes in Tarim Interior River Basin using 3S [D]. Lanzhou: Cold and Arid Regions Environmental and Engineering Research Institute, Chinese Academy of Sciences(2007).
[27] H Shangguan D, Y Liu S, F Ding L et al. Variation of glaciers in the western Nyainqetanglha range of Tibetan Plateau during 1970-2000. Journal of Glaciology and Geocryology, 30, 204-210(2008).
[28] F Shi Y. Estimation of the water resources affected by climatic warming and glacier shrinkage before 2050 in west China. Journal of Glaciology and Geocryology, 23, 333-341(2001).
[29] F Shi Y. A Concise China Glacier Inventory.(2005).
[30] F Shi Y, Y Liu S. Pre-estimation for the response of China glaciers to global warming in the 21st century. Chinese Science Bulletin, 45, 434-438(2000).
[31] P Sun M, Y Liu S, J Yao X et al. Glacier changes in the Qilian Mountains in the past half century: Based on the revised first and second Chinese glacier inventory. Journal of Geographical Sciences, 28, 206-220(2018).
[32] Q Wang C, B Yang T, Q Ji et al. Remote sensing monitoring of glacier changes in the middle region of Tanggula Mountain. Arid Land Geography, 39, 504-512(2016).
[33] W Wang, Y Xiang, Y Gao et al. Rapid expansion of glacial lakes caused by climate and glacier retreat in the Central Himalayas. Hydrological Processes, 29, 859-874(2015).
[34] S Williams R, K Hall D, O Sigurosson. Comparison of satellite-derived with ground-based measurements of the fluctuations of the margins of Vatnajökull, Iceland, 1973-92. Annals of Glaciology, 24, 72-80(1997).
[35] P Wu K, Y Liu S, J Bao W et al. Recent glacier mass balance and area changes in the Kangri Karpo Mountains from DEMs and glacier inventories. Cryosphere, 12, 103-121(2018).
[36] C Xie Z, H Liu C. Introduction to Glaciology.(2010).
[37] C Xing W, Q Li Z, H Zhang et al. Spatial-temporal variation of glacier resources in Tien Shan Mountains since. Journal of Geographical Sciences, 72, 1594-1605(2017).
[38] Q Xu B, J Cao J, J Hansen et al. Black soot and the survival of Tibetan glaciers. Proceedings of the National Academy of Sciences., 106, 22114-22118(2009).
[39] Q Xu, L Ding. Paleoelevation research on Gangdisê Mountains and Tibetan Plateau. China Science Foundation, 54-59(2015).
[40] J Yao X, Y Liu S, Q Guo W et al. Glacier change of Altay Mountain in China from 1960 to 2009: Based on the Second Glacier Inventory of China. Journal of Natural Resources, 27, 1734-1745(2012).
[41] T Yao, L Thompson, W Yang et al. Different glacier status with atmospheric circulations in Tibetan Plateau and surroundings. Nature Climate Change, 2, 663-667(2012).
[42] H Ye Q, F Chen, D Yao T et al. Tupu of glacier variations in the Mt. Naimonanyi region, western Himalayas, in the last three decades. Journal of Remote Sensing, 11, 511-520(2007).
[43] Y You L, C Yang J. Geomorphology in China.(2013).
[44] T Zhang J, J He X, H Shangguan D et al. Impact of intensive glacier ablation on arid regions of northwest China and its countermeasure. Journal of Glaciology and Geocryology, 34, 848-854(2012).
[45] Y Zhu H, B Yang T, Z Tian H et al. Glacier variation in the Altun Mountains from 1973 to 2010. Geographical Research, 32, 1430-1438(2013).


Set citation alerts for the article
Please enter your email address

© Copyright 2018-2021 | Chinese Laser Press. All Rights Reserved 沪ICP备15018463号-20