• Photonics Research
  • Vol. 8, Issue 10, 1558 (2020)
Jun Ma1, Yang He1, Xue Bai1, Li-Peng Sun1..., Kai Chen1, Kyunghwan Oh2 and Bai-Ou Guan1,*|Show fewer author(s)
Author Affiliations
  • 1Guangdong Provincial Key Laboratory of Optical Fiber Sensing and Communications, Institute of Photonics Technology, Jinan University, Guangzhou 511443, China
  • 2Photonic Device Physics Laboratory, Department of Physics, Yonsei University, Seoul 033722, South Korea
  • show less
    DOI: 10.1364/PRJ.394941 Cite this Article Set citation alerts
    Jun Ma, Yang He, Xue Bai, Li-Peng Sun, Kai Chen, Kyunghwan Oh, Bai-Ou Guan, "Flexible microbubble-based Fabry–Pérot cavity for sensitive ultrasound detection and wide-view photoacoustic imaging," Photonics Res. 8, 1558 (2020) Copy Citation Text show less
    Schematic of a surface microbubble photothermally generated at an MOF tip for photoacoustic imaging of RBCs in a blood vessel.
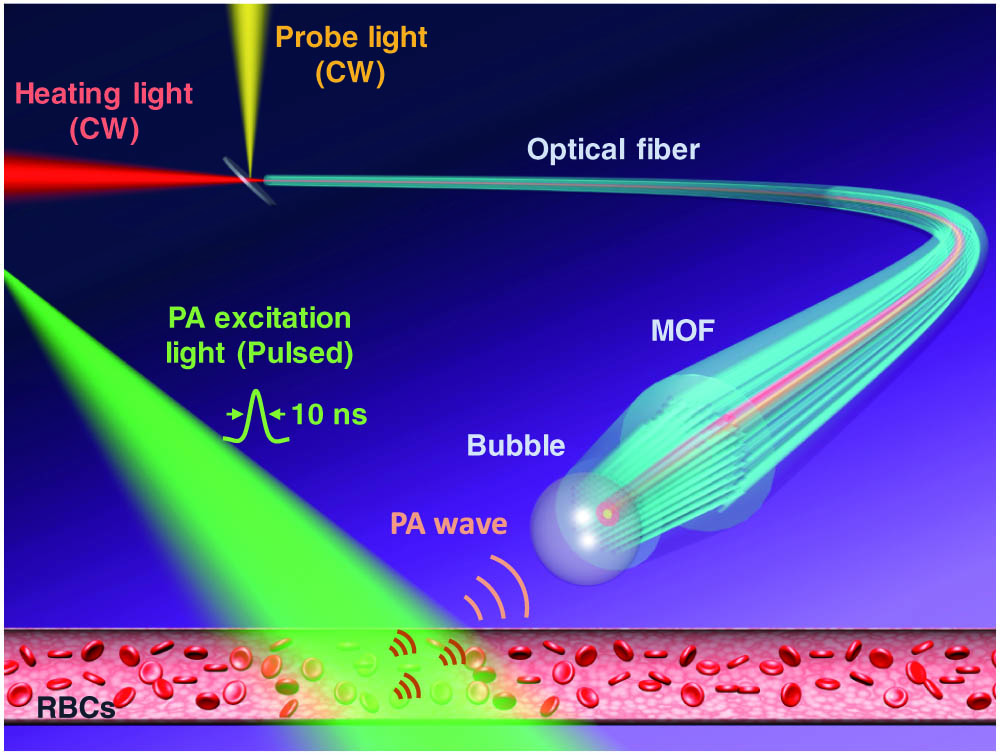
    Fig. 1. Schematic of a surface microbubble photothermally generated at an MOF tip for photoacoustic imaging of RBCs in a blood vessel.
    (a) Microscope image of an MOF; inset: SEM image. (b), (c) SEM images of cross sections of the MOF at different locations as indicated by dashed lines 1 and 2 in (a); the inset in (c) shows the close-up image of the MOF core. (d) Microscope image of a photothermally generated microbubble on the MOF tip facet.
    Fig. 2. (a) Microscope image of an MOF; inset: SEM image. (b), (c) SEM images of cross sections of the MOF at different locations as indicated by dashed lines 1 and 2 in (a); the inset in (c) shows the close-up image of the MOF core. (d) Microscope image of a photothermally generated microbubble on the MOF tip facet.
    (a) Temporal evolutions of the bubble diameter during growth and decay at different heating powers. (b) Heating powers for the SMF and the MOF to generate a 20 μm diameter bubble in the distilled water.
    Fig. 3. (a) Temporal evolutions of the bubble diameter during growth and decay at different heating powers. (b) Heating powers for the SMF and the MOF to generate a 20 μm diameter bubble in the distilled water.
    (a) Measured and calculated reflection spectrum of a microbubble at different diameters. Inset: microscope images of the MOF-supported microbubbles. (b) Schematic of the light propagation inside the microbubble. (c) Profiles of the calculated electrical field distribution across the center of the MOF and the tapered SMF end facets; inset: the mode field distribution at the MOF end facet. (d) Transmission coefficient as functions of the bubble diameter for MOF and SMF.
    Fig. 4. (a) Measured and calculated reflection spectrum of a microbubble at different diameters. Inset: microscope images of the MOF-supported microbubbles. (b) Schematic of the light propagation inside the microbubble. (c) Profiles of the calculated electrical field distribution across the center of the MOF and the tapered SMF end facets; inset: the mode field distribution at the MOF end facet. (d) Transmission coefficient as functions of the bubble diameter for MOF and SMF.
    (a) Schematic of the experimental setup for ultrasound detection; DAQ, data acquisition unit; PC, personal computer. (b) Ultrasound response of a 10 μm diameter microbubble to the sinusoidal ultrasound wave with an amplitude of 100 Pa and a frequency of 700 kHz; RBW, resolution bandwidth. Inset: ultrasound response in the time domain. (c) SNR and NEP versus the ultrasound frequency. (d) Directivity of the microbubble for ultrasound waves at different frequencies.
    Fig. 5. (a) Schematic of the experimental setup for ultrasound detection; DAQ, data acquisition unit; PC, personal computer. (b) Ultrasound response of a 10 μm diameter microbubble to the sinusoidal ultrasound wave with an amplitude of 100 Pa and a frequency of 700 kHz; RBW, resolution bandwidth. Inset: ultrasound response in the time domain. (c) SNR and NEP versus the ultrasound frequency. (d) Directivity of the microbubble for ultrasound waves at different frequencies.
    (a) Schematic of the photoacoustic imaging process by using a microbubble-based ultrasound sensor; inset: received temporal PA signals. (b) Photograph of the microbubble-based ultrasound sensor inserted into a needle for imaging the blood-filled tubes. (c) Acquired PA signals emitted from the blood-filled tubes; inset: frequency spectrum of the measured PA signal (PA1). (d) Reconstructed cross-section image of the blood-filled tubes.
    Fig. 6. (a) Schematic of the photoacoustic imaging process by using a microbubble-based ultrasound sensor; inset: received temporal PA signals. (b) Photograph of the microbubble-based ultrasound sensor inserted into a needle for imaging the blood-filled tubes. (c) Acquired PA signals emitted from the blood-filled tubes; inset: frequency spectrum of the measured PA signal (PA1). (d) Reconstructed cross-section image of the blood-filled tubes.
    Jun Ma, Yang He, Xue Bai, Li-Peng Sun, Kai Chen, Kyunghwan Oh, Bai-Ou Guan, "Flexible microbubble-based Fabry–Pérot cavity for sensitive ultrasound detection and wide-view photoacoustic imaging," Photonics Res. 8, 1558 (2020)
    Download Citation