Abstract
Interaction of acoustic waves and microbubbles occurs in numerous biomedical applications including ultrasound imaging, drug delivery, lithotripsy treatment, and cell manipulation, wherein the acoustically driven microbubbles routinely act as active microscale oscillators or actuators. In contrast, microbubbles were utilized here as passive receivers to detect broadband ultrasound waves in aqueous environments. The microbubble was photothermally generated on a microstructured optical fiber (MOF) tip, forming a flexible Fabry–Pérot cavity whose gas–water interface was sensitive to ultrasound waves. The MOF severed as both a low-loss waveguide and a compact light condenser, allowing high-efficiency generation and stabilization of ultrasmall microbubbles. Integrated with all-fiber interferometry, a 10 μm diameter microbubble exhibited a low noise-equivalent pressure level of and a broad bandwidth of , capable of detecting weak ultrasounds emitted from red blood cells irradiated by pulsed laser light. With advantages of high sensitivity, compact size, and low cost, the microbubble-based ultrasound sensor has great potential in biomedical imaging and sensing applications.1. INTRODUCTION
Acoustic actuation of microbubbles has attracted extensive research interest over the past decades [1,2]. When subjected to acoustic waves, the gas–liquid interface of the microbubble contracts and expands periodically, and it emits strong shock waves if cavitation occurs [3,4]. With inherent flexibility and aqueous compatibility, microbubbles have been exploited for various biomedical applications including ultrasound imaging [5], intercellular transport of molecules [6], noninvasive treatment of acute intravascular thrombi [7], and opening of blood brain barrier [8]. In particular, microbubbles generated by laser heating at liquid-immersed solid surfaces are attractive to biological studies because the bubble location can be easily controlled by the focal spot of the laser [9]. These photothermally generated microbubbles, after being driven by acoustic waves [10], can serve as a powerful tool for trapping particles/cells and inducing shear force on cell membranes [11,12].
In the abovementioned studies, microbubbles were routinely driven by external acoustic or ultrasonic waves and acted as active mechanical components, such as microscale actuators or ejectors. There are few reports on the use of the highly flexible microbubble as a passive component for underwater acoustic detection, which plays an important role in a number of applications including underwater communication and sonar, nondestructive testing, and biomedical ultrasonic/photoacoustic imaging [13–15]. The possible reasons are as follows. First, the microbubble generally suffers rapid dissolution caused by the high Laplace pressure, which is inversely proportional to its radius as predicted by the Epstein–Plesset theory [16,17]. The fast-decaying feature of the microbubble inspires applications including particle/cell lithography [18] and volumetric display [19] but hinders the stable acquisition of the bubble deformation caused by acoustic waves. Second, the numerical aperture (NA) of the microscope objective and the camera frame rate limit the resolution and the speed to read out the bubble deformation [20], posing a problem for detecting weak and high-frequency acoustic waves.
Recently, photothermally generated microbubbles have been investigated for reconfigurable plasmonic lenses and tunable surface plasmon polaritons [21,22]. The bubble diameter depends on the amount of localized heat generated at the laser focal spot and thus can be precisely tuned by changing the heating laser power. By virtue of this photothermal tunability, we previously stabilized a microbubble on the tip facet of a standard single-mode fiber (SMF) through automatic servo control of the heating power [23]. The stabilized microbubble and the fiber tip facet formed a low-finesse Fabry–Pérot cavity, which could resolve the deformation of the gas–water interface much more accurately and faster than an optical microscope. The SMF-supported microbubble showed its capability of detecting weak acoustic waves, but its frequency bandwidth was limited to , at least 1 order of magnitude narrower than the need for nondestructive testing or photoacoustic/ultrasound imaging. In addition, the heating power required to generate the microbubble was on the level of tens of milliwatts, which might cause adverse thermal effects to samples such as biological cells or tissues.
Sign up for Photonics Research TOC. Get the latest issue of Photonics Research delivered right to you!Sign up now
To address the above issues, we demonstrated a miniature surface microbubble photothermally generated on the tip facet of a microstructured optical fiber (MOF). The MOF severed as both a low-loss waveguide and a compact light condenser, which tightly focused the heating light at the fiber tip facet. The small focal spot allowed efficient generation of microbubbles and thus reduced the laser heating power compared with the previously employed SMF. Moreover, the MOF greatly increased the spectrum fringe contrast of microbubbles with diameters less than 10 μm, which enabled sensitive detection of high-frequency ultrasounds up to and wide-view photoacoustic imaging of red blood cells (RBCs) irradiated under short laser pulses.
2. MICROBUBBLE GENERATION AND STABILIZATION
Compared to free-space optics, optical fibers with the advantages of being easy to use and being immune to environmental vibrations were employed to deliver the heating laser for photothermal generation of microbubbles. Instead of the conventional SMF, an MOF comprising of a tiny silica core surrounded by air holes was employed as both a low-loss waveguide and a compact light condenser as shown in Fig. 1.
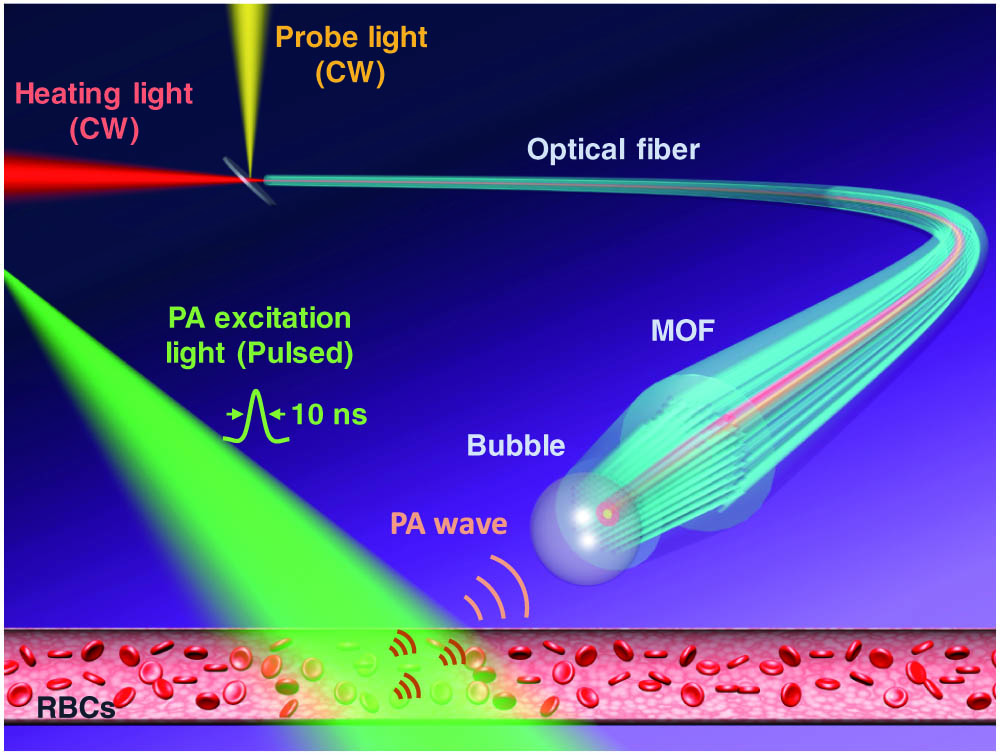
Figure 1.Schematic of a surface microbubble photothermally generated at an MOF tip for photoacoustic imaging of RBCs in a blood vessel.
The MOF was fabricated in the following process. A piece of SMF (SMF-28, Corning) was first spliced with a section of photonic crystal fiber (PCF, LMA-10, NKT Photonics) via a fusion splicer (FSM-45PM, Fujikura). The other pigtail of the PCF was sealed in a gas chamber connected to a high-pressure nitrogen cylinder. The PCF was then heated by a hydrogen flame located at 2–3 mm from the SMF/PCF splicing point and simultaneously pulled by two linear translation stages. To prevent the PCF from collapsing during the tapering process, nitrogen gas with a pressure of 5–6 bars was supplied to the inner holes of the PCF via the gas chamber [24]. The diameter of the tapered PCF was controlled by the tapering time and the pulling speed of the translation stages. After cutting the tapered PCF at its waist with a fiber cleaver (FC-6S, Sumitomo Electric) under a microscope, the MOF with a fiber tip structure was obtained with its microscope image as shown in Fig. 2(a). During the cleaving, the two ends of the MOF were placed horizontally and slightly stretched to keep the fiber straight. The height of the cleaver bladder was adjusted to reduce the distance between the fiber and the bladder considering the smaller diameter of the MOF than the normal SMF. After optimizing the bladder height by trial and error, the MOF can be cleaved with a flat and smooth end surface, which is critical to increase the spectral fringe contrast of the microbubble-based Fabry–Pérot cavity as will be discussed later. To estimate the insertion loss caused by the above-described splicing, tapering, and cleaving procedures, the reflectivity of the MOF end facet was measured in the wavelength band from 1530 to 1610 nm and compared with that of the silica/air interface (). The measured reflectivity for MOF is , which corresponds to an insertion loss of . Figures 2(b) and 2(c) show the scanning electron microscope (SEM) images of cross sections at different locations along the MOF. The core and cladding diameters of the MOF at its end facet are and , respectively.

Figure 2.(a) Microscope image of an MOF; inset: SEM image. (b), (c) SEM images of cross sections of the MOF at different locations as indicated by dashed lines 1 and 2 in (a); the inset in (c) shows the close-up image of the MOF core. (d) Microscope image of a photothermally generated microbubble on the MOF tip facet.
The microbubble was subsequently generated by delivering 980 nm heating light from a continuous-wave (CW) pump laser to the end facet of the MOF. The facet of the MOF was coated with a layer of 4 nm thick Au film to increase light absorption. The Au film generated localized heat that vaporized the distilled water surrounding the MOF core and initiated the bubble nucleation. The gases originally dissolving in the water then quickly diffused into the bubble, causing it to grow. Figure 2(d) shows a photothermally generated microbubble on the MOF tip facet. The temporal evolutions of the bubble diameter during the growth and decay process were recorded using a charge-coupled device (CCD) camera. As shown in Fig. 3(a), the temporal evolutions of the bubble diameter at different heating powers suggest that a larger heating power results in a higher growth rate. The temporal growth of the bubble diameter follows a relationship of with the heating time . As the heating light is switched off, the bubble starts to decay, and the bubble lifetime shows a quadratic dependence on the initial bubble diameter [25]. The relationship between the bubble lifetime and diameter is found to be dependent on the gas–vapor ratio in the bubble composition that plays an important role in the bubble shrinkage dynamics [26]. In principle, the bubble diameter can be precisely controlled by adjusting the heating power or duration. However, the bubble growth process is quite fast at its early stage, which prevents accurate control of the bubble diameter, especially for those with a diameter of less than 20 μm. In the experiment, the procedure for the bubble generation is as follows: a bubble larger than the desired size is generated, and subsequently the heating laser is switched off; once the bubble slowly shrinks to the desired value, the heating laser is servo controlled via an electronically variable optical attenuator (EVOA, EVOA800A, Thorlabs) to stabilize the bubble [23]. Based on the recorded temporal evolution of the bubble diameter after the servo control, the root-mean-square (RMS) value of the fluctuation is , which is over 2 orders of magnitude smaller than the wavelength (1550 nm) of the probe light for ultrasound detection. The average heating power required to nucleate a 20 μm diameter bubble at the MOF end facet is , about half of that needed for the SMF as shown in Fig. 3(b). The reduced heating power is attributed to the tight concentration of light by the MOF with a small fiber core, which improves the biosafety of the MOF-supported microbubble for applications involving biological tissues or cells.
Figure 3.(a) Temporal evolutions of the bubble diameter during growth and decay at different heating powers. (b) Heating powers for the SMF and the MOF to generate a 20 μm diameter bubble in the distilled water.
The dynamics underlying the microbubble stabilization can be understood by resorting to the gas diffusion equation, Henry’s law, and the Laplace equation [27,28]. The long lifetime of a microbubble under optical heating is a result of the balance between the diffusion of the dissolved gases into and out from the bubble through its gas/liquid interface [29]. As the bubble diameter is significantly larger than the spot size of the heating laser, the heat generated by the laser inside the bubble results in a nonuniform spatial distribution of temperature in the water surrounding the bubble. The molecular flux density can then be described as follows: where is the molecular diffusivity, is the concentration of air molecules in the water, and is the Soret coefficient [30]. On the right-hand of Eq. (1), the first term describes the gas diffusion from the bubble to the surrounding liquid driven by the concentration gradient, which originates from the Laplace pressure caused by the surface tension at the gas–liquid interface. The second term accounts for the temperature gradient induced by the laser heating, which causes thermophoresis, facilitating an inverse gas diffusion process. As a result, the bubble stabilization by servo controlling the heating power is a dynamic process to photothermally balance the gas diffusion into and out from the bubble.
3. OPTICAL REFLECTION SPECTRUM
As the microbubble at the MOF tip can be regarded as a low-finesse Fabry–Pérot cavity, a larger fringe contrast of the reflection spectrum gives a higher sensitivity for dynamic pressure [31]. To characterize its reflection spectrum, light from a broadband source (BBS, 1525–1575 nm) was delivered to the bubble via an optical circulator and a wavelength-division multiplexer (WDM, 980/1550 nm). The light reflected from the end facet of the MOF and the air/water interface of the bubble was collected by an optical spectrum analyzer (OSA).
Figure 4(a) shows the measured and calculated reflection spectrum of a single microbubble stabilized at different diameters. The reflection spectrum can be described by the relationship between the reflected light intensity and the optical wavelength as , where is the refractive index of the gases in the bubble and is the constant phase shift. is the fringe contrast of the bubble reflection spectrum and can be described by where and are the reflectivities of the fiber end (interface 1) and the air/water interface (interface 2), respectively, and is the transmission coefficient that accounts for the light propagation loss between interfaces 1 and 2 [see Fig. 4(b)]. The fringe contrast of the reflection spectrum increases from 4 to 7.4 dB as the diameter decreases from 35 to 12 μm. Based on Eq. (2), the higher spectrum fringe contrast for the smaller bubble is a result of the increased transmission coefficient, which can be analyzed by the transfer matrix method [32]. For a bubble with radius of , its transfer matrix can be written as where , , and account for the propagation from interface 1 to 2, the reflectance at interface 2, and the propagation from the interface 2 to 1 of the light beam, respectively. Based on the transfer matrix , the waist radius and the radius of curvature of the beam reflected back to the fiber end (interface 1) can be calculated using the ABCD law [32]. The transmission coefficient is then obtained by where is the waist radius of the light beam in SMF. For the SMF, the waist radius of the light beam can be calculated from the Marcuse equation and is [33]. For the MOF with a core diameter of 2.6 μm, the waist radius as simulated by the finite element method (COMSOL Multiphysics) is in the water and slightly smaller in the air as shown in Fig. 4(c). This indicates that the penetration of the water into the MOF holes induces negligible difference on the waist radius of the light beam. In fact, we found that the water only entered into the holes for several tens of micrometers due to the increased pressure since the other end of the MOF was sealed by the spliced SMF. Moreover, the laser-generated heat caused the expansion of air in the holes surrounding the MOF core and extruded the water outside. Therefore, the water penetration has negligible influence on the transmitted light beam and the bubble stabilization process of the MOF, and it can be further alleviated after making the MOF tip hydrophobic through chemical surface treatment in the future [34].
Figure 4.(a) Measured and calculated reflection spectrum of a microbubble at different diameters. Inset: microscope images of the MOF-supported microbubbles. (b) Schematic of the light propagation inside the microbubble. (c) Profiles of the calculated electrical field distribution across the center of the MOF and the tapered SMF end facets; inset: the mode field distribution at the MOF end facet. (d) Transmission coefficient as functions of the bubble diameter for MOF and SMF.
Figure 4(d) shows the calculated and the measured transmission coefficients for the microbubbles generated by an MOF and an SMF, and the transmission coefficients are plotted together for clear comparison. It can be observed that the MOF has a maximum coupling coefficient at a bubble diameter nearly 1 order of magnitude smaller than that of the SMF. This difference is attributed to the times smaller waist radius of the light beam in MOF compared with the SMF. The tightly focused mode field of MOF greatly increases the transmission coefficient by over 3 times at a bubble diameter of and thus increases the spectrum fringe contrast. For comparison, the electrical field distribution in a tapered SMF with the same diameter (40 μm) as the MOF was simulated, and the profile of the electrical field distribution across the fiber end facet center is shown in Fig. 4(c). Different from the MOF, the beam waist of the tapered SMF increases after the tapering treatment. This is a result of the reduced light confinement, which causes the transform of the core-guided optical mode to the cladding-guided mode [35,36]. In contrast, the MOF features a large refractive index difference between the fiber core and the holey cladding compared to the SMF, which can strongly confine the optical mode in the fiber core. Although microfibers tapered from SMFs can have a similar light spot size to that of the MOF, their several-micrometer diameters greatly increase the difficulty of fiber cleaving and manipulation. As a result, the use of MOF is critical to develop small microbubbles for sensitive ultrasound detection. Moreover, the small microbubbles are important for broadband ultrasound detection since the frequency bandwidths of the bubbles are inversely proportional to their diameters as will be discussed next.
4. ULTRASOUND RESPONSE
To evaluate the response of the microbubble-based ultrasound sensor, ultrasound waves were generated using a piezoelectric ultrasound transducer (UT, XM-W1M, Xieming Ultrasonics) driven by a signal generator as shown in Fig. 5(a). During the test, both the UT and the sensor were immersed into a water tank. As the microbubble has a small diameter of , orders of magnitude smaller than the acoustic wavelength, the ultrasound wave reaching the bubble surface can be regarded as the plane wave and the perturbation caused by the ultrasound wave reflected by the bubble can be neglected. Probe light from a distributed feedback (DFB) laser with a wavelength of 1550 nm and a power of 10 mW was delivered to the bubble through an optical circulator and a WDM. The reflected light from the bubble after travelling through the WDM and the circulator was detected by a photodiode detector (PD). The DC component of the output signal from the PD was exacted using a low-pass filter (LPF) and used as the feedback to servo control the 980 nm heating light through the EVOA for the bubble stabilization. The AC component acquired using a band-pass filter (BPF) was measured by a signal analyzer to recover the ultrasound signal. To maximize the ultrasound sensitivity, the wavelength of the probe light was locked to the quadrature point of the bubble reflection spectrum by photothermally tuning the bubble diameter instead of using an expensive wavelength-tunable laser.
Figure 5.(a) Schematic of the experimental setup for ultrasound detection; DAQ, data acquisition unit; PC, personal computer. (b) Ultrasound response of a 10 μm diameter microbubble to the sinusoidal ultrasound wave with an amplitude of 100 Pa and a frequency of 700 kHz; RBW, resolution bandwidth. Inset: ultrasound response in the time domain. (c) SNR and NEP versus the ultrasound frequency. (d) Directivity of the microbubble for ultrasound waves at different frequencies.
Figure 5(b) shows the response of the microbubble to sinusoidal ultrasound waves with an amplitude of 100 Pa and a frequency of 700 kHz by driving the UT with a sinusoidal electrical signal. The noise-limited pressure level (NEP) of the microbubble is estimated to be , almost 2 orders of magnitude higher than a silica-diaphragm-based ultrasound sensor [37]. For a freely-oscillating microbubble in the water, the ratio of the bubble diameter change to the dynamic pressure can be expressed as , where is the bubble radius, is the polytropic coefficient, is the pressure in the bubble, is the ambient pressure outside the bubble, and is the surface tension at room temperature [1]. As the polytropic coefficient at adiabatic condition [17], the pressure sensitivity for a 10 μm diameter bubble is calculated to be , which corresponds to a minimum detectable displacement of if the measurement bandwidth is 1 MHz. This value is orders of magnitude higher than the spatial resolution of a conventional optical microscope as used in a previous study [20]. The resonant frequency can be determined by the expression [38], where is the density of water. By using several UTs of different working frequencies, we have characterized the frequency response of the bubble as shown in Fig. 5(c). It exhibits a resonant frequency near 700 kHz, similar to the theoretically predicted value of . The inverse proportion of the resonant frequency to the bubble radius suggests that smaller bubbles are preferred for broader frequency bandwidth to increase the resolution of ultrasound/photoacoustic imaging [39]. It needs to mention that the ultrasound responses were only measured at several individual frequencies because of the limited number of UTs. The frequency response can be characterized more accurately using a broadband ultrasound source with a calibrated frequency spectrum.
Owing to its spherical shape and much smaller size than the acoustic wavelength, the 10 μm diameter microbubble is supposed to have a nearly omnidirectional response [40]. We measured the sensor directivity by rotating the UT around the microbubble placed at the center of a rotation stage [see Fig. 5(a)]. Based on the results as shown in Fig. 5(d), the wide acceptance angle and the high per-unit-area sensitivity make the microbubble-based ultrasound sensor an ideal point-like detector for photoacoustic (PA) imaging, which can alleviate the limited-view problem suffered by flat ultrasonic transducers and improve the tangential resolution for ultrasonic/photoacoustic imaging.
5. PHOTOACOUSTIC IMAGING
PA is a hybrid modality based on the detection of ultrasonic waves generated by illuminating a sample with short laser pulses. It combines the high contrast of optical imaging and the deep penetration of ultrasound imaging. Thereby, PA imaging is promising for preclinical/clinical applications such as the diagnosis of melanoma cancer and breast cancer [41,42]. Figure 6(a) shows the schematic of the photoacoustic computed tomography (PACT) imaging using a microbubble-based ultrasound sensor. A 532 nm Nd:YAG laser (Dawa 100, Beamtech) with a pulse width of 6.5 ns and a repetition rate of 10 Hz was used to excite PA signals. The laser pulses were first homogenized and expanded via a beam diffuser (DG10-120, Thorlabs) and then delivered to a sample comprising two parallel plastic tubes. The tubes with an inner diameter of were filled with bovine blood [see Fig. 6(b)]. The light fluence of the laser irradiated on the plastic tube was . The blood inside the tubes absorbed the light, expanded thermally, and emitted ultrasound waves. The microbubble-based ultrasound sensor, after being encapsulated within a syringe needle using epoxy to alleviate the vibration-caused position inaccuracy, was mounted onto a linear translation stage and scanned horizontally across the sample. The scanning range and step were 3 cm and 10 μm, respectively. Based on the laser repetition rate of 10 Hz, the current scanning speed was 0.1 mm/s. During the scanning, the bubble after photothermal stabilization had a diameter fluctuation () similar to the stationary case, thanks to the firm attachment of the bubble to the fiber end facet [43]. During each scan, the PA signal received by the microbubble was recorded by a data acquisition unit (DAQ) with a sampling rate of 10 MHz. The pulsed laser, linear translation stage, and DAQ were synchronized during the imaging process. The temporal PA signals acquired at different locations during the linear scanning were then used to reconstruct the two-dimensional image based on the universal back-projection (BP) algorithm [44,45]. The reconstruction principle can be described as follows. As the microbubble is scanned from position to , the PA waves emitted from the source point reach the bubble after the flight times and , respectively. The flight time (or ), after being multiplied by the sound velocity , then gives the distance between the source and the position (or ). Based on the PA signals measured at different positions along the object, for example, from to , the location of the source can be determined.
Figure 6.(a) Schematic of the photoacoustic imaging process by using a microbubble-based ultrasound sensor; inset: received temporal PA signals. (b) Photograph of the microbubble-based ultrasound sensor inserted into a needle for imaging the blood-filled tubes. (c) Acquired PA signals emitted from the blood-filled tubes; inset: frequency spectrum of the measured PA signal (). (d) Reconstructed cross-section image of the blood-filled tubes.
Figure 6(c) shows the typical PA signals as received by the microbubble-based ultrasound sensor after 10 times average. The two PA signals were emitted from the two laser-illuminated blood tubes, where the laser beams were delivered from the two sides of the tube to avoid direct radiation of the sensor by the pulsed laser light. This dark illumination is also important for reducing surface signals in photoacoustic imaging of biological tissues [46]. The inset of Fig. 6(c) is the frequency spectrum obtained by performing the Fourier transform on the measured PA signals () in the time domain. A frequency bandwidth of 0.8 MHz corresponds to an axial resolution of [47], which agrees with the value estimated from the profile of the blood tubes in Fig. 6(d). This frequency bandwidth well suits for photoacoustic imaging of the human breast, where the structures of interest commonly have sizes ranging from the centimeter to submillimeter scale and emit ultrasound waves with frequencies from several tens of kilohertz to a few megahertz [48]. Thus, the proposed microbubble-based ultrasound sensor with a bandwidth of may provide a compact and all-optics solution for photoacoustic breast imaging [49]. Currently, the radiant exposure on the blood tubes was , times lower than the American National Standards Institute (ANSI) safety limit (). In addition, the light scattering in the biological tissue would further reduce the light fluence delivered on the sample. Therefore, the cross sections of the blood tubes were imaged to show the capability of the sensor for biological imaging. With a high-energy pulsed laser in the future, the laser spot will be expanded to illuminate a large area with sufficient light fluence for raster-scanning three-dimensional in vivo imaging of biological tissues.
Compared to the reported high-finesse polymer convex Fabry–Pérot cavity [50], the microbubble-based ultrasound sensor is with low cost and exhibits a similar ultrasound sensitivity without elaborate deposition of high-reflectivity dielectric films on a convex surface, but its bandwidth is lower and insufficient for high-resolution imaging of fine biological tissue structures or cells [46]. We have attempted to fabricate smaller bubbles that feature broader bandwidth, while their larger decay rate [see Fig. 3(a)] requires more accurate and faster servo control for bubble stabilization. In addition to optimization of the servo-control process in terms of speed and precision, bubble generation by the MOF tip encapsulated in degassed-water-filled tube with one opening covered with a sound-transparent polymer film will be carried out to obtain stable bubbles with diameters less than 10 μm in the future [51].
6. SUMMARY
We demonstrated a flexible microbubble-based fiber-tip Fabry–Pérot cavity for sensitive and broadband ultrasound detection and ex vivo photoacoustic imaging of bovine blood-filled tubes. By using an MOF with a core size of 2.6 μm, the heating power for bubble generation can be greatly reduced, and, more importantly, small bubbles with diameters down to 10 μm can be obtained without degradation of the spectrum fringe contrast. The 10 μm diameter microbubble exhibited a megahertz-level frequency bandwidth and a low NEP of . This sensitive, miniature, and cost-effective microbubble-based fiber-optic ultrasound sensor is attractive for applications including photoacoustic/ultrasonic imaging and sensing as well as other biological or chemical studies.
References
[1] T. G. Leighton. The Acoustic Bubble(1994).
[2] C. E. Brennen. Cavitation and Bubble Dynamics(2013).
[3] S. Sirsi, M. Borden. Microbubble compositions, properties and biomedical applications. Bubble Sci. Eng. Technol., 1, 3-17(2009).
[4] E. P. Stride, C. C. Coussios. Cavitation and contrast: the use of bubbles in ultrasound imaging and therapy. Proc. Inst. Mech. Eng. H, 224, 171-191(2010).
[5] C. Errico, J. Pierre, S. Pezet, Y. Desailly, Z. Lenkei, O. Couture, M. Tanter. Ultrafast ultrasound localization microscopy for deep super-resolution vascular imaging. Nature, 527, 499-502(2015).
[6] R. Lachaine, C. Boutopoulos, P. Y. Lajoie, E. Boulais, M. Meunier. Rational design of plasmonic nanoparticles for enhanced cavitation and cell perforation. Nano Lett., 16, 3187-3194(2016).
[7] F. Xie, J. Lof, C. Everbach, A. He, R. M. Bennett, T. Matsunaga, J. Johanning, T. R. Porter. Treatment of acute intravascular thrombi with diagnostic ultrasound and intravenous microbubbles. JACC Cardiovasc. Imaging, 2, 511-518(2009).
[8] J. J. Choi, M. Pernot, S. A. Small, E. E. Konofagou. Noninvasive, transcranial and localized opening of the blood-brain barrier using focused ultrasound in mice. Ultrasound Med. Biol., 33, 95-104(2007).
[9] L. Lin, X. Peng, Z. Mao, W. Li, M. N. Yogeesh, B. B. Rajeeva, E. P. Perillo, A. K. Dunn, D. Akinwande, Y. Zheng. Bubble-pen lithography. Nano Lett., 16, 701-708(2016).
[10] A. Hashmi, G. Yu, M. Reilly-Collette, G. Heiman, J. Xu. Oscillating bubbles: a versatile tool for lab on a chip applications. Lab Chip, 12, 4216-4227(2012).
[11] Y. Xie, C. Zhao, Y. Zhao, S. Li, J. Rufo, S. Yang, F. Guo, T. J. Huang. Optoacoustic tweezers: a programmable, localized cell concentrator based on opto-thermally generated, acoustically activated, surface bubbles. Lab Chip, 13, 1772-1779(2013).
[12] Y. Xie, N. Nama, P. Li, Z. Mao, P. H. Huang, C. Zhao, F. Costanzo, T. J. Huang. Probing cell deformability via acoustically actuated bubbles. Small, 12, 902-910(2015).
[13] M. Martins, V. Correia, J. M. Cabral, S. Lanceros-Mendez, J. G. Rocha. Optimization of piezoelectric ultrasound emitter transducers for underwater communications. Sens. Actuators A, 184, 141-148(2012).
[14] B. W. Drinkwater, P. D. Wilcox. Ultrasonic arrays for non-destructive evaluation: a review. NDT & E Int., 39, 525-541(2006).
[15] G. Wissmeyer, M. A. Pleitez, A. Rosenthal, V. Ntziachristos. Looking at sound: optoacoustics with all-optical ultrasound detection. Light Sci. Appl., 7, 53(2018).
[16] P. S. Epstein, M. S. Plesset. On the stability of gas bubbles in liquid-gas solutions. J. Chem. Phys., 18, 1505-1509(1950).
[17] S. Ljunggren, J. C. Eriksson. The lifetime of a colloid-sized gas bubble in water and the cause of the hydrophobic attraction. Colloid. Surf. A, 129–130, 151-155(1997).
[18] L. Lin, E. H. Hill, X. Peng, Y. Zheng. Optothermal manipulations of colloidal particles and living cells. Acc. Chem. Res., 51, 1465-1474(2018).
[19] K. Kumagai, S. Hasegawa, Y. Hayasaki. Volumetric bubble display. Optica, 4, 298-302(2017).
[20] N.-G. Kim, K.-W. Lee. Analysis of the linear decrease in the reflectivity measured for bubbles growing on a substrate in a liquid for dissolved-gas sensor applications. Sens. Actuators B, 284, 1-6(2019).
[21] C. Zhao, Y. Liu, Y. Zhao, N. Fang, T. J. Huang. A reconfigurable plasmofluidic lens. Nat. Commun., 4, 2305(2013).
[22] F. Gan, Y. Wang, C. Sun, G. Zhang, H. Li, J. Chen, Q. Gong. Widely tuning surface plasmon polaritons with laser-induced bubbles. Adv. Opt. Mater., 5, 1600545(2017).
[23] H. Xu, G. Wang, J. Ma, L. Jin, K. Oh, B.-O. Guan. Bubble-on-fiber (BoF): a built-in tunable broadband acousto-optic sensor for liquid-immersible in situ measurements. Opt. Express, 26, 11976-11983(2018).
[24] C. Wang, W. Jin, J. Ma, Y. Wang, H. L. Ho, X. Shi. Suspended core photonic microcells for sensing and device applications. Opt. Lett., 38, 1881-1883(2013).
[25] R. S. Taylor, C. Hnatovsky. Growth and decay dynamics of a stable microbubble produced at the end of a near-field scanning optical microscopy fiber probe. J. Appl. Phys., 95, 8444-8449(2004).
[26] M. E. Zaytsev, Y. Wang, Y. Zhang, G. Lajoinie, X. Zhang, A. Prosperetti, H. J. W. Zandvliet, D. Lohse. Gas-vapor interplay in plasmonic bubble shrinkage. J. Phys. Chem. C, 124, 5861-5869(2020).
[27] Y. Wang, M. E. Zaytsev, L. T. Hai, J. C. T. Eijkel, H. J. W. Zandvliet, X. Zhang, D. Lohse. Vapor and gas-bubble growth dynamics around laser-irradiated, water-immersed plasmonic nanoparticles. ACS Nano, 11, 2045-2051(2017).
[28] D. Lohse, X. Zhang. Surface nanobubbles and nanodroplets. Rev. Mod. Phys., 87, 981-1035(2015).
[29] G. Baffou, J. Polleux, H. Rigneault, S. Monneret. Super-heating and micro-bubble generation around plasmonic nanoparticles under CW illumination. J. Phys. Chem. C, 118, 4890-4898(2014).
[30] S. Duhr, D. Braun. Why molecules move along a temperature gradient. Proc. Natl. Acad. Sci. USA, 103, 19678-19682(2006).
[31] J. Ma, H. Xuan, H. L. Ho, W. Jin, Y. Yang, S. Fan. Fiber-optic Fabry–Pérot acoustic sensor with multilayer graphene diaphragm. IEEE Photon. Technol. Lett., 25, 932-935(2013).
[32] W. L. Emkey, C. A. Jack. Analysis and evaluation of graded-index fiber lenses. J. Lightwave Technol., 5, 1156-1164(1987).
[33] D. Marcuse. Loss analysis of single-mode fiber splices. Bell Syst. Tech. J., 56, 703-718(1977).
[34] L. Xiao, T. A. Birks, W. H. Loh. Hydrophobic photonic crystal fibers. Opt. Lett., 36, 4662-4664(2011).
[35] D. J. Love. Spot size, adiabaticity and diffraction in tapered fibres. Electron. Lett., 23, 993-994(1987).
[36] T. G. Tiecke, K. P. Nayak, J. D. Thompson, T. Peyronel, N. P. de Leon, V. Vuletić, M. D. Lukin. Efficient fiber-optical interface for nanophotonic devices. Optica, 2, 70-75(2015).
[37] J. Liu, L. Yuan, J. Lei, W. Zhu, B. Cheng, Q. Zhang, Y. Song, C. Chen, H. Xiao. Micro-cantilever-based fiber optic hydrophone fabricated by a femtosecond laser. Opt. Lett., 42, 2459-2462(2017).
[38] J. D. N. Cheeke. Fundamentals and Applications of Ultrasonic Waves(2016).
[39] G. Ku, X. Wang, G. Stoica, L. V. Wang. Multiple-bandwidth photoacoustic tomography. Phys. Med. Biol., 49, 1329-1338(2004).
[40] T. J. Allen, O. Ogunlade, E. Zhang, P. C. Beard. Large area laser scanning optical resolution photoacoustic microscopy using a fibre optic sensor. Biomed. Opt. Express, 9, 650-660(2018).
[41] Y. Zhou, S. V. Tripathi, I. Rosman, J. Ma, P. Hai, G. P. Linette, M. L. Council, R. C. Fields, L. V. Wang, L. A. Cornelius. Noninvasive determination of melanoma depth using a handheld photoacoustic probe. J. Invest. Dermatol., 137, 1370-1372(2017).
[42] R. A. Kruger, C. M. Kuzmiak, R. B. Lam, D. R. Reinecke, S. P. Del Rio, D. Steed. Dedicated 3D photoacoustic breast imaging. Med. Phys., 40, 113301(2013).
[43] R. S. Taylor, C. Hnatovsky. Trapping and mixing of particles in water using a microbubble attached to an NSOM fiber probe. Opt. Express, 12, 916-928(2004).
[44] M. Xu, L. V. Wang. Universal back-projection algorithm for photoacoustic computed tomography. Phys. Rev. E, 71, 016706(2005).
[45] C. Cai, X. Wang, K. Si, J. Qian, J. Luo, C. Ma. Feature coupling photoacoustic computed tomography for joint reconstruction of initial pressure and sound speed in vivo. Biomed. Opt. Express, 10, 3447-3462(2019).
[46] J. Aguirre, M. Schwarz, N. Garzorz, M. Omar, A. Buehler, K. Eyerich, V. Ntziachristos. Precision assessment of label-free psoriasis biomarkers with ultra-broadband optoacoustic mesoscopy. Nat. Biomed. Eng., 1, 0068(2017).
[47] M. Xu, L. V. Wang. Analytic explanation of spatial resolution related to bandwidth and detector aperture size in thermoacoustic or photoacoustic reconstruction. Phys. Rev. E, 67, 056605(2003).
[48] W. Xia, D. Piras, J. C. G. Van Hespen, S. Van Veldhoven, C. Prins, T. G. Van Leeuwen, W. Steenbergen, S. Manohar. An optimized ultrasound detector for photoacoustic breast tomography. Med. Phys., 40, 032901(2013).
[49] S. Manohar, M. Dantuma. Current and future trends in photoacoustic breast imaging. Photoacoustics, 16, 100134(2019).
[50] J. A. Guggenheim, J. Li, T. J. Allen, R. J. Colchester, S. Noimark, O. Ogunlade, I. P. Parkin, I. Papakonstantinou, A. E. Desjardins, E. Z. Zhang, P. C. Beard. Ultrasensitive plano-concave optical microresonators for ultrasound sensing. Nat. Photonics, 11, 714-719(2017).
[51] K. Namura, K. Nakajima, M. Suzuki. Quasi-stokeslet induced by thermoplasmonic Marangoni effect around a water vapor microbubble. Sci. Rep., 7, 45776(2017).


