• Matter and Radiation at Extremes
  • Vol. 6, Issue 2, 026904 (2021)
M. J.-E. Manuel1、a), B. Khiar2, G. Rigon3, B. Albertazzi3, S. R. Klein4, F. Kroll5, F. -E. Brack5、6, T. Michel3, P. Mabey3, S. Pikuz7, J. C. Williams1, M. Koenig3, A. Casner8, and C. C. Kuranz4
Author Affiliations
  • 1General Atomics, San Diego, California 92121, USA
  • 2University of Chicago, Chicago, Illinois 60637, USA
  • 3Laboratoire pour l’utilisation des lasers intenses, 91128 Palaiseau Cedex, France
  • 4University of Michigan, Ann Arbor, Michigan 48109, USA
  • 5Helmholtz-Zentrum Dresden-Rossendorf, 01328 Dresden, Germany
  • 6Technische Universität Dresden, 01062 Dresden, Germany
  • 7National Research Nuclear University, Moscow 115409, Russia
  • 8Centre lasers intenses et applications, 33405 Talence Cedex, France
  • show less
    DOI: 10.1063/5.0025374 Cite this Article
    M. J.-E. Manuel, B. Khiar, G. Rigon, B. Albertazzi, S. R. Klein, F. Kroll, F. -E. Brack, T. Michel, P. Mabey, S. Pikuz, J. C. Williams, M. Koenig, A. Casner, C. C. Kuranz. On the study of hydrodynamic instabilities in the presence of background magnetic fields in high-energy-density plasmas[J]. Matter and Radiation at Extremes, 2021, 6(2): 026904 Copy Citation Text show less

    Abstract

    Blast-wave-driven hydrodynamic instabilities are studied in the presence of a background B-field through experiments and simulations in the high-energy-density (HED) physics regime. In experiments conducted at the Laboratoire pour l’utilisation des lasers intenses (LULI), a laser-driven shock-tube platform was used to generate a hydrodynamically unstable interface with a prescribed sinusoidal surface perturbation, and short-pulse x-ray radiography was used to characterize the instability growth with and without a 10-T B-field. The LULI experiments were modeled in FLASH using resistive and ideal magnetohydrodynamics (MHD), and comparing the experiments and simulations suggests that the Spitzer model implemented in FLASH is necessary and sufficient for modeling these planar systems. These results suggest insufficient amplification of the seed B-field, due to resistive diffusion, to alter the hydrodynamic behavior. Although the ideal-MHD simulations did not represent the experiments accurately, they suggest that similar HED systems with dynamic plasma-β (=2μ0ρv2/B2) values of less than ~100 can reduce the growth of blast-wave-driven Rayleigh–Taylor instabilities. These findings validate the resistive-MHD FLASH modeling that is being used to design future experiments for studying B-field effects in HED plasmas.

    I. INTRODUCTION

    Hydrodynamic instabilities such as Richtmyer–Meshkov (RM), Kelvin–Helmholtz (KH), and Rayleigh–Taylor (RT) have been studied for decades in high-energy-density (HED) plasmas. These mechanisms dominate the late-time behavior of inertial confinement fusion (ICF) implosions1,2 and are prevalent in the evolution of astrophysical systems such as supernovae3,4 and supernova remnants5–7 such as the Crab Nebula. In the classically studied RT-unstable system, two homogenous, semi-infinite, stratified fluids undergo a constant acceleration (g) where, in the reference frame of the interface, the lighter fluid (ρl) supports the heavier fluid (ρh). Single-mode perturbations at the interface, with wave number k = 2π/λ, grow exponentially initially at the classical growth rate γcl=Akg, where A = (ρhρl)/(ρh + ρl) is the Atwood number of the interface.8 In the HED plasma environment, linear growth rates can be reduced by the presence of a density scale length at the interface,9 through ablation,10 and by radiative effects,4,11 among other stabilizing mechanisms. As amplitudes approach ∼0.1λ, the growth rate saturates and the interpenetration depth of heavy spikes and light bubbles increases at a constant rate during the nonlinear growth phase.12 As high-density spikes fall through the lower-density material, the interface along the spikes is unstable to KH growth. This is often most prominent at the tip of a spike, where the characteristic “mushroom cap” is formed by KH vortices. In the single-mode formalism, the onset of KH at the spike tips begins the cascade of energy transfer to smaller scales, leading eventually to turbulent mixing of the light and heavy fluids. Magnetic fields present in these hydrodynamically unstable plasmas are predicted to alter this behavior.5,13

    λc=4πB2cos2θμ0gΔρ,where θ is the angle between the B-field and the single-mode wave vector, and Δρ=ρhρl is the density difference between the two fluids. This simple scaling is shown to be consistent with observations of the Crab Nebula.

    II. MAGNETIZED RAYLEIGH–TAYLOR GROWTH IN CRAB NEBULA

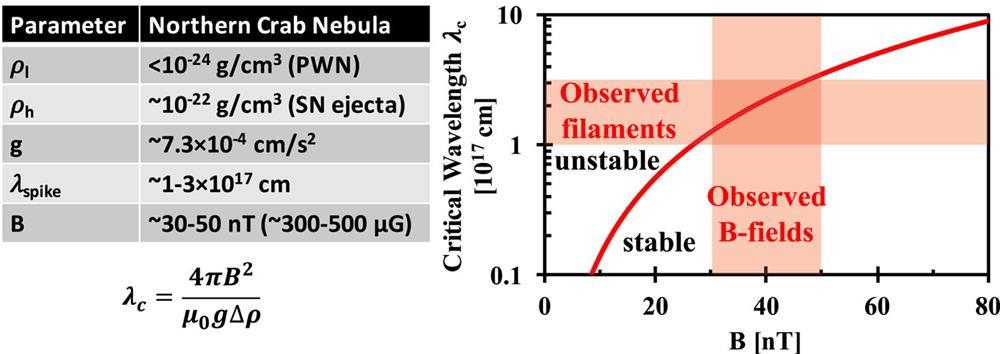
    Observations of RT growth in the Crab Nebula reveal long, stable spikes that are not broken apart by secondary KH evolution.5,6,15 A leading theory to explain these observations involves magnetic stabilization13,16,17 provided by the ∼30-nT–50-nT B-fields that are present across the entirety of the nebula.7 These large-scale fields run roughly east–west across the nebula, but at smaller scales they follow the hydrodynamic motion due to the ideal-MHD nature of the plasma. Therefore, on the northern and southern edges of the Crab Nebula, the background B-fields are nearly parallel to the expanding shock front. The observed plasma parameters in the northern region are listed in Fig. 1 alongside a plot of λc as a function of B-field strength. Note that the observed scale of RT spikes in the late nonlinear regime is near the critical wavelength and lies within a narrow wavelength band. This is consistent with linear theory in that (i) long wavelengths grow more slowly than short wavelengths and (ii) B-fields stabilized wavelengths shorter than λc early in the evolution of the supernova remnants. In the work described herein, the aim was to observe a reduction in RT growth due to background B-fields in a similar blast-wave-driven, RT-unstable plasma.

    Critical wavelength plotted as a function of B-field strength for Rayleigh–Taylor (RT)-relevant parameters in the northern edge of the Crab Nebula. In this system, the low-density pulsar wind nebula (PWN) pushes on the high-density supernova (SN) ejecta.

    Figure 1.Critical wavelength plotted as a function of B-field strength for Rayleigh–Taylor (RT)-relevant parameters in the northern edge of the Crab Nebula. In this system, the low-density pulsar wind nebula (PWN) pushes on the high-density supernova (SN) ejecta.

    III. MAGNETIZED RAYLEIGH–TAYLOR EXPERIMENTAL PLATFORM

    High-power laser facilities are often used to study hydrodynamic instabilities in HED plasmas.4,18,19 In these experiments, a nanosecond-scale laser pulse is incident on a (typically) plastic ablator, driving a shock that propagates from a high-density material into a lower-density material. When the laser is turned off and the rarefaction wave reaches the shock front, a decelerating blast wave is created that makes the interface between the high- and low-density regions unstable to RT growth. Figure 2 shows the critical wavelength in a parameter space relevant to this type of HED experiment. It is clear from Eq. (2) and Fig. 2 that smaller Δρ and g values have larger critical wavelengths, i.e., easier to observe and measure. Even at low growth parameters of Δρ ∼ 0.4 g/cc and g ∼ 1 μm/ns2 (known as “low-drive” experiments),4,18 a 10-T B-field provides a critical wavelength of ∼2 μm, which is a difficult spatial scale to resolve with conventional x-ray radiography techniques.20,21

    Contour plots of λc (μm) as a function of Δρ and g for typical parameter ranges found in laser-driven experiments with a 10-T or 40-T B-field aligned parallel to the wave vector in the ideal-MHD limit.

    Figure 2.Contour plots of λc (μm) as a function of Δρ and g for typical parameter ranges found in laser-driven experiments with a 10-T or 40-T B-field aligned parallel to the wave vector in the ideal-MHD limit.

    Creating higher B-field strengths will increase λc to more-resolvable scales, e.g., at these same growth parameters, a 40-T field produces λc ∼ 40 μm. A 40-T field maintained for the duration of the experiment is achievable22 but is difficult and expensive to provide with the laser and diagnostic access necessary for hydrodynamic instability experiments. Smaller ∼10-T field strengths are more easily achievable, but total growth suppression below the critical wavelength is unresolvable. Nevertheless, a 10-T B-field that is amplified through two-dimensional (2D) flux compression (B/ρ ≈ constant)23 to ∼40 T can reduce the exponential RT growth rate of a λ = 120-μm mode to ∼80% of its classical value, resulting in a measurable difference in overall amplitude growth. Experimental observation of RT-growth suppression and model verification are the ultimate goals of the present project, this being because these effects are yet to be measured in a blast-wave-driven plasma environment relevant to magnetized ICF implosions and astrophysical systems.

    A. Experimental configuration at LULI laser facility

    Experiments were performed at the LULI2000 laser facility; see Figs. 3(a) and 3(b). The platform comprises a layered physics package driven by 500 J of 527-nm light in a 1.5-ns square pulse with a ∼500-μm-diameter phase plate (I ∼ 1.7 × 10¹⁴ W/cm2). The target comprises an 8-μm polystyrene ablator followed by an iodinated plastic (CHI) with a density of 1.65 g/cc and a 8.5-mg/cc GACH foam, which is a polymer-based foam with a 1:1 C:H ratio; see Appendix A. The measured composition of the CHI is C3.8H3.3I0.4, representing a 5.3-at. % dopant content. The CHI has a nominal thickness of L0 = 43 μm and is machined with pre-imposed sinusoidal perturbations with a wavelength of λ = 120 μm and a peak-to-valley (P–V) amplitude of 20 μm. With a nominal energy of E0 = 500 J, the laser initiates a shock wave in the ablator that propagates through the CHI and into the low-density foam. When the shock reaches the CHI–foam interface, it drives an RM instability that causes a phase inversion of the perturbation and subsequent amplitude growth. The shock evolves into a blast wave after the laser is turned off, causing the system to decelerate and thus initiating an RT instability in the reference frame of the interface. The post-shock plasma conditions set the parameters for RT growth and will change slowly over time as CHI spikes “fall” into the low-density foam.

    (a) Schematic of physics package, laser drive, and B-field orientation across rippled interface. (b) Experimental setup showing x-ray radiography configuration with B-field now out of the page. Streaked self-emission is also collected with a field of view aligned with the shock tube to measure interface velocity. (c) Predicted density distributions from resistive- and ideal-MHD simulations at 20 ns illustrating the effect of a 10-T B-field on the RT evolution in LULI experiments under varying resistivities. (d) Shock position (similar in all cases) and peak-to-valley (P–V) amplitudes plotted as a function of time. The cases of B = 0 T and nominal Spitzer resistivity overlap, as suggested by the images shown in (c). Under ideal-MHD conditions, the P–V amplitude deviates significantly from that in the unmagnetized and nominal-Spitzer cases.

    Figure 3.(a) Schematic of physics package, laser drive, and B-field orientation across rippled interface. (b) Experimental setup showing x-ray radiography configuration with B-field now out of the page. Streaked self-emission is also collected with a field of view aligned with the shock tube to measure interface velocity. (c) Predicted density distributions from resistive- and ideal-MHD simulations at 20 ns illustrating the effect of a 10-T B-field on the RT evolution in LULI experiments under varying resistivities. (d) Shock position (similar in all cases) and peak-to-valley (P–V) amplitudes plotted as a function of time. The cases of B = 0 T and nominal Spitzer resistivity overlap, as suggested by the images shown in (c). Under ideal-MHD conditions, the P–V amplitude deviates significantly from that in the unmagnetized and nominal-Spitzer cases.

    The amplitude growth is characterized by short-pulse x-ray radiography. A ∼20-μm–25-μm vanadium wire backlighter is irradiated by a defocused beam containing ∼40 J of 1054-nm light in a 10-ps pulse.19 The wire provides ∼4.9-keV x-rays with ∼20-μm–30-μm spatial resolution (see Appendix B) and ∼10-ps temporal resolution.21 The wire is 4 cm from the target, outside a pulsed-power solenoid. The solenoid was provided by Helmholtz-Zentrum Dresden-Rossendorf and was tailored to match the experimental demands. It is part of a versatile pulsed-power technology suite for laser-driven plasma experiments. The physics package is inside the solenoid that is capable of delivering a spatially uniform 10-T B-field across the entire target. The solenoid is triggered ∼90 μs before the lasers are fired to allow the B-field to reach its maximum value across the ∼60-ns duration of the experiment. Each shot provides a single radiograph of the hydrodynamic evolution, and the RT growth is assessed by analyzing multiple shots taken with different delays (∼10 ns–50 ns) between the drive and backlighter laser beams, with and without the 10-T B-field. The self-emission from the shocked CHI is collected from a ∼80-μm-wide, ∼4-mm-long field of view that is detected on a streak camera (∼4-μm spatial resolution and ∼1-ns temporal resolution) to diagnose the interface velocity and constrain the modeling.

    B. MHD simulations of LULI experiments

    The present experiments are simulated using the radiation–MHD code FLASH, which is used to simulate HED laboratory experiments as well as many astrophysical phenomena.24 The full target is simulated in a 2D Cartesian geometry using adaptive mesh refinement, flux-limited heat conduction (f = 0.06), tabulated equations of state, ray tracing for laser energy deposition, and 40 photon groups for diffusive radiation transport. Unmagnetized FLASH calculations suggest that the plasma conditions are ∼5 eV (∼1 eV) and ∼30 mg/cc (∼300 mg/cc) in the shocked foam (dense pusher) for times greater than ∼7 ns, suggesting Spitzer resistivities ηS > 10−6 Ω-m.25 Under these conditions, the resistivity of the plasma is very sensitive to the electron temperature and charge state. Recent work26–28 has shown that under conditions similar to those predicted by FLASH, transport coefficients such as resistivity can be overestimated by a factor of ∼100. In this case, the HED plasma may behave more like a conductor and less like the insulator suggested by a Spitzer treatment.

    Results from resistive- and ideal-MHD FLASH calculations in the form of the mass-density plots at t = 20 ns shown in Fig. 3(c) illustrate the transition of behavior from unmagnetized to ideal-MHD under varying degrees of resistivity for the RT evolution in the LULI experiments. The shock (vs ∼ 45 km/s) and average interface (vi ∼ 40 km/s) trajectories are not significantly altered with the 10-T applied field because the Hall parameter (χe = ωceτe, where ωce is the electron cyclotron frequency and τe is the electron collision time) is quite low. Even in the ideal-MHD case, we have χe ≲ 10−2, suggesting no alteration of transport due directly to the B-field. Using a Spitzer treatment, the magnetic Reynolds number (Remμ0viλ/η) in the shocked foam is Rem ∼ 1, suggesting no change in the nonlinear RT morphology due to the applied 10-T field. However, if the Spitzer model in FLASH overestimates the resistivity in this sensitive region of parameter space, then the plasma may behave more like a conductor than an insulator. A reduction in resistivity by a factor of 100 (Rem ∼ 100) indicates suppression of small-scale features around the spikes but only a slight change in P–V amplitude. In the extreme scenario of a perfect conductor, the ideal-MHD treatment indicates a measurable difference in the P–V amplitude between the magnetized and unmagnetized cases after ∼10 ns for the LULI experimental conditions, as shown in Fig. 3(d).

    IV. EXPERIMENTAL RESULTS

    A. Flat-foil results

    To characterize the drive and validate the FLASH modeling, experiments were performed using flat CHI foils with and without the 10-T B-field. X-ray radiography and streaked optical emission collected through the shock tube are used to diagnose the interface location and axial velocity. Experimental radiographs are shown in Fig. 4(a) at three different experimental times for both the 0-T and 10-T cases. The CHI interface is shown to propagate into the low-density GACH foam (darker color indicates higher opacity), but the shock location in the foam is not visible because of the low opacity of the foam, even after compression. Each radiograph is analyzed individually after first applying low and high bandpass filters to remove high-frequency statistical noise and low-frequency non-uniformities. From a lineout taken in the central region, the interface location is easily retrieved and is plotted in Fig. 4(b). Uncertainties in the interface location are approximately the same size as the symbols, and the dominant source of error is in determining the absolute propagation distance (±30 μm–40 μm).29 Data points are plotted against scaled time, where small variations (≲10%–20%) in target thickness (L) and drive energy (E) are accounted for by scaling the measured experimental time of each shot by a factor of (E/E0)1/3(L0/L)1/3 as suggested by Swisher.30 Scaling the experimental time for each shot allows for an accurate comparison across multiple shots, and as such the horizontal uncertainty is smaller than the symbol size.

    (a) Radiographs from flat CHI experiments at three different times with and without the 10-T B-field. (b) Experimental positions of the CHI interface from radiographs for B = 0 T (blue squares) and B = 10 T (red circles). Ideal-MHD FLASH calculations (solid lines) predict no difference in the interface position and fit parabolic trajectories (dotted lines past 30 ns). The high-opacity (dark gray) region near the bottom of each x-ray radiograph is caused by mid-Z shielding near the base of the target.

    Figure 4.(a) Radiographs from flat CHI experiments at three different times with and without the 10-T B-field. (b) Experimental positions of the CHI interface from radiographs for B = 0 T (blue squares) and B = 10 T (red circles). Ideal-MHD FLASH calculations (solid lines) predict no difference in the interface position and fit parabolic trajectories (dotted lines past 30 ns). The high-opacity (dark gray) region near the bottom of each x-ray radiograph is caused by mid-Z shielding near the base of the target.

    These data suggest that the interface location does not change significantly when the 10-T B-field is applied, consistent with similar plasma conditions due to a low Hall parameter. The CHI trajectory from ideal-MHD simulations is shown in Fig. 4(b) for comparison with the experimental data. Because of the domain of the simulation, interface tracking stops at ∼29 ns, but the interface position fits nearly perfectly to a parabolic trajectory (−0.296t2 + 48.3t − 25.6). Although similar calculations of the rippled CHI targets shown in Fig. 3(d) show a dramatic change in amplitude growth, the interface location is not expected to change because of the presence of the B-field.

    The simulated CHI trajectory is also shown to track the leading edge of optical self-emission measured in the experiments. A typical streak camera image is shown in Fig. 5, where the heated CHI plasma is observed to propagate down the shock tube (consistent with FLASH calculations) and expand in the axial (vertical) direction.31 The signal brightens in time because of the increased optical transparency as the CHI expands, rather than the plasma becoming hotter and emitting more photons. Between 30 ns and 40 ns, the leading edge of the plasma emission begins to deviate from the parabolic trajectory (dotted line), suggesting that thermal expansion is beginning to dominate over hydrodynamic growth. The interface experiences a near-constant deceleration of g ∼ 0.59 μm/ns2 that characterizes the trajectory well for t ≲ 30 ns. These results demonstrate that 2D FLASH calculations capture the bulk hydrodynamic behavior in both the magnetized and unmagnetized cases but do not provide a means to differentiate between resistive and ideal MHD.

    Streaked optical emission data for a B = 0 T shot with the simulated CHI trajectory (solid line) and extrapolated parabolic fit (dotted line). Expansion of the CHI begins to cause deviation from the parabolic fit for t ≳ 30 ns. Consistent with the radiographic data from flat CHI experiments, the typical streaked emission data are unchanged upon adding a 10-T B-field.

    Figure 5.Streaked optical emission data for a B = 0 T shot with the simulated CHI trajectory (solid line) and extrapolated parabolic fit (dotted line). Expansion of the CHI begins to cause deviation from the parabolic fit for t ≳ 30 ns. Consistent with the radiographic data from flat CHI experiments, the typical streaked emission data are unchanged upon adding a 10-T B-field.

    B. Sinusoidal-foil results

    Experimental results obtained using a CHI target with preimposed sinusoidal surface perturbations (λ = 120 μm, P–V = 20 μm) are shown in Fig. 6. In Fig. 6(a), sample x-ray radiographs for the unmagnetized and magnetized cases show the perturbation growth as a function of time as the high-density spikes penetrate into the low-density foam. Similar to the flat radiographs shown in Fig. 4, the shock is not visible because of the low opacity of the compressed CH foam, but the amplitude growth is clear and benchmarked FLASH simulations suggest that the shock propagates ahead of the spike tips. To characterize the instability evolution, the P–V amplitudes of the central wavelengths are measured over many shots with and without the applied 10-T B-field.

    (a) Experimental x-ray radiographs of CHI foils with machined sinusoidal perturbations with wavelength λ = 120 μm and initial P–V amplitude 20 μm. (b) Measurements of P–V amplitude as a function of time for experiments with (red circles) and without (blue circles) a 10-T B-field. FLASH simulation results from Fig. 3 are shown as well.

    Figure 6.(a) Experimental x-ray radiographs of CHI foils with machined sinusoidal perturbations with wavelength λ = 120 μm and initial P–V amplitude 20 μm. (b) Measurements of P–V amplitude as a function of time for experiments with (red circles) and without (blue circles) a 10-T B-field. FLASH simulation results from Fig. 3 are shown as well.

    Measurements from x-ray radiographs taken up to 45 ns after laser onset show no discernible effect on the P–V amplitude growth from the presence of the seeded 10-T B-field. Radiographs from 21 separate experiments—10 shots with a B-field and 11 shots without—show that the P–V amplitude grows at a nearly constant rate of ∼9.5 μm/ns up to ∼30 ns after laser onset, saturating shortly thereafter. Each radiograph is analyzed individually using the same bandpass filtering as for the flat foil data and then isolating the region of interest containing the RT spikes and bubbles. An unsharp mask is used to enhance the edge contrast to determine the locations of each peak and valley in the central region, then the difference is taken and plotted in Fig. 6(b) as the P–V amplitude. The vertical error bars are calculated using the random uncertainty in determining the edges of the peaks and valleys in the center of the tube through the analysis process. This procedure removes the systematic uncertainty of absolute spike or valley location and illustrates the uncertainty only in the measured P–V amplitude on a single shot, which is dominated by radiograph quality. The data are plotted against time scaled to account for target and laser variations, as discussed previously, making the temporal uncertainty smaller than the symbol size. Figure 6(b) shows that these data are consistent with 2D resistive-MHD FLASH calculations using a Spitzer resistivity model.

    V. DISCUSSION

    Bt×v×B×ημ0×B,where η and v are the local Spitzer resistivity and fluid velocity, respectively. In the ideal-MHD treatment, only the first term on the right-hand side of Eq. (3) is kept. In the case of ideal-MHD, the 10-T seed B-field can be amplified to over 130 T because of ideal 2D flux compression. The spatial structure in the B-field strength also follows the fluid flow, following the “frozen in” understanding of B-field evolution. With this level of B-field amplification, the dynamic plasma-β (β = 2μ0ρv2/B2) in the low-density foam (ρl ∼ 30 mg/cc) and high-density pusher (ρh ∼ 300 mg/cc) is ∼7 and ∼70, respectively.32 From these simple estimates and the ideal-MHD simulations shown in Fig. 7, one may expect that β ≲ 100 indicates a plasma wherein the B-field may affect the RT evolution. However, the ideal-MHD picture is not representative of the experimental system.

    B-field distributions (T) from ideal- and resistive-MHD FLASH calculations. Ideal MHD predicts >10× increase in B-field strength, whereas a Spitzer model in resistive MHD shows an increase of ∼ 2×.

    Figure 7.B-field distributions (T) from ideal- and resistive-MHD FLASH calculations. Ideal MHD predicts >10× increase in B-field strength, whereas a Spitzer model in resistive MHD shows an increase of ∼ 2×.

    Resistivity plays an important role in the evolution of the B-field and allows B-field lines to diffuse both ahead and behind the shocked foam region, as illustrated in Fig. 7. The Spitzer-driven diffusion, as modeled in FLASH, still suggests B-field amplification by a factor of ∼2 and occupies a much larger region in the plasma than predicted by ideal-MHD calculations. Assuming Spitzer resistivities, a fluid velocity of ∼40 km/s, and a length scale of ∼120 μm, the magnetic Reynolds numbers for the shocked foam and pusher are ∼0.9 and ∼0.03, respectively, emphasizing the importance of diffusion in the system. Amplified B-fields of ∼20 T suggest plasma-β values of ∼300 and ∼3000 for plasma bubbles and spikes, respectively. Observation of B-field effects on hydrodynamic instabilities in blast-wave-driven HED systems, such as those discussed herein, requires β ≲ 100 as shown in ideal-MHD calculations.

    To reduce β for future experiments, stronger seed B-fields may be implemented or the platform may be altered to achieve more-favorable plasma conditions. External B-fields of strengths up to ∼40 T have been generated22 to magnetize HED plasmas with long temporal (≳20 ns) and spatial (≳1 mm) scales. With no additional platform changes, a fourfold increase of this initial field value results in β ∼ 20 in the shocked foam. To reduce β further, the interface velocity could be reduced by decreasing the laser energy and increasing the foam density. Pushing the platform closer to the ideal-MHD regime requires higher temperatures, which reduce the resistivity in the plasma and increase the B-field amplification. This can be achieved by increasing the ripple wavelength and by reducing the density of the rippled pusher and increasing the laser drive, although the latter two platform changes will also increase the velocity. As temperatures are increased in the future experiments, thermal conduction,33 Nernst advection,23 and radiative effects4 on RT evolution will need to be considered. A combination of platform changes will be necessary to generate plasma conditions with higher Rem in the future experiments for driving B-field effects on blast-wave-driven hydrodynamic instabilities that are relevant to magnetized fusion implosions and astrophysical objects.

    The primary finding of the work discussed herein, namely the importance of resistivity in these experiments, clearly differentiates the laboratory and astrophysical systems in a very fundamental way. Additionally, radiative cooling in the swept-up supernova ejecta and RT-spike tips is also believed to play an important role in RT evolution within the Crab Nebula,6,7 although this is not relevant in the present experimental platform. Table I lists nominal parameters for the northern rim of the Crab Nebula and the parameters that were achieved in the LULI experiments. While a direct hydrodynamic scaling34,35 is not yet possible between the Crab Nebula and a laboratory system, one of the ultimate goals of this project is to demonstrate magnetic stabilization of blast-wave-driven hydrodynamic instabilities, which is yet to be observed in the laboratory, and validate the modeling of these systems. Future experiments will focus on increasing Rem by increasing the laser energy and reducing the mass density of the rippled pusher. If Rem can be increased, then the plasma will behave closer to the ideal-MHD limit, thereby significantly increasing the B-field amplification in the plasma and achieving a more astrophysically relevant experimental platform.

    CrabLULI
    ρl (g/cm3)≲10−24∼3 × 10−2 (A = 6.5, Zmax = 3.5)
    ρh (g/cm3)∼10−22∼3 × 10−1 (A = 13.3, Zmax = 6.3)
    g (cm/s2)∼7.3 × 10−4∼5.9 × 10¹³
    λRT (cm)∼2 × 10171.2 × 10−2
    B (T)∼40 × 10−9∼20
    γcl1 (s)∼6.7 × 10⁹∼6.3 × 10⁻⁹
    vdrift (cm/s)∼108∼40 × 105
    ni,l (cm−3)∼1.5 × 10⁻¹∼2.8 × 10²¹
    ni,h (cm−3)∼1.5 × 10²∼1.3 × 10²²
    Z∼1∼1
    Tl (eV)∼2∼5
    Th (eV)∼2∼1
    βl∼1.6∼3 × 10²
    βh∼1.6 × 10³∼3 × 10³
    Rem,l∼3 × 10¹⁸∼0.9
    Rem,h∼3 × 10¹⁸∼0.03
    Rel∼1.3 × 10⁶∼1.2 × 10⁵
    Reh∼1.1 × 10⁹∼2.3 × 10⁸

    Table 1. Nominal parameters for northern rim of Crab Nebula5–7,15,36 and LULI experiments.

    VI. SUMMARY

    Background magnetic fields can alter the evolution of hydrodynamic instabilities in magnetized inertial fusion plasmas and in astrophysical objects, such as the Crab Nebula. The first laboratory experiments to study these effects in blast-wave-driven RT-unstable systems were performed at the LULI facility using a laser-driven shock-tube platform with a pulsed-power solenoid that provided a 10-T B-field across the entire target volume. Analysis of over 20 individual experiments showed no measurable difference in the P–V amplitude growth between the 0-T and 10-T cases. These results are consistent with resistive-MHD FLASH calculations using a Spitzer resistivity model. Ideal-MHD FLASH simulations, while not representative of the experimental system, do predict a suppression of RT growth and now provide insight into which plasma regime is necessary for observing this phenomenon in the laboratory, i.e., an upper estimate of the minimum plasma beta (β ≲ 100) necessary to observe a modification in RT growth. Resistive-MHD FLASH simulations showed no difference between the 0-T and 10-T cases but did show that the B-field was amplified approximately twofold. With this level of B-field amplification, the achieved plasma-β was too high (∼300) for the field to alter the hydrodynamic behavior. This work demonstrates the necessity of using resistive MHD to model these planar laboratory systems and that a Spitzer model is sufficient for the plasma conditions expected in these environments. Future experiments will focus on increasing the magnetic Reynolds number to achieve a system closer to the ideal-MHD limit while also increasing the background B-field strength.

    APPENDIX A: GACH FOAM CHARACTERISTICS

    The low-density foam (~8.5 mg/cc) used in these experiments is a new polymer-based aerogel developed at General Atomics [see Fig. 8(a)]. This material has a 1:1 C:H ratio, making it ideal for applications requiring low-Z materials. This foam material has been doped covalently with deuterium (GACD), or with nanoparticles of mid-to high-Z materials, such as gold or zinc-oxide [see Fig. 8(b)]. It is often cast into the desired shape or laser-cut, but higher-density foam (?100 mg/cc) can also be machined through traditional techniques. Plastic and metal coatings have been demonstrated on these foams [see Fig. 8(c)] and show little to no penetration of the coating into the foam structure. GACH can be fabricated at densities of ~2 mg/cc–200 mg/cc with pore sizes typically less than ~1 μm, making this foam an ideal candidate for low-Z, low-density applications.

    Scanning electron microscope images of different versions of GACH: (a) 8.5-mg/cc GACH foam used in this work, showing sub-micron pore structure; (b) 30-mg/cc GACH showing uniform distribution of ZnO nanoparticles; (c) shard from a GACH sphere coated with 5 μm of solid gas-discharge-polymer (GDP), showing no penetration of the coating material into the foam structure.

    Figure 8.Scanning electron microscope images of different versions of GACH: (a) 8.5-mg/cc GACH foam used in this work, showing sub-micron pore structure; (b) 30-mg/cc GACH showing uniform distribution of ZnO nanoparticles; (c) shard from a GACH sphere coated with 5 μm of solid gas-discharge-polymer (GDP), showing no penetration of the coating material into the foam structure.

    APPENDIX B: BACKLIGHTER CHARACTERIZATION

    As shown in Figs. 9(a) and 9(a) gold mesh was attached to each target to characterize the magnification and spatial resolution of the x-ray radiography diagnostic. The 63.5-μm pitch of the mesh allows for accurate measurement of the magnification and is shown to be isotropic by lineouts in both the near-axial and near-radial directions, as shown in Fig. 9(b). The edge of the mesh provides a quasi knife edge with which to measure the resolution limit of the diagnostic. Figure 9(c) shows a lineout across the edge and the best-fit ideal knife edge blurred with a Gaussian with a standard deviation of σ = 11 pixels. Using the measured magnification and 25-μm pixel size, the inferred 2σ resolution of this shot is ~32 μm. This resolution limit is set by the effective source size, which depends on the diameter of the wire target, the angle relative to the intended line of sight, and the emission of the plasma as it expands during the 10-ps pulse.21

    (a) X-ray radiograph of undriven target showing foam-filled shock tube; the CHI is obscured by the shielding. (b) Lineouts of mesh in near-axial and near-radial directions show an isotropic magnification of 17.2. (c) A Gaussian blur with a standard deviation of 11 pixels fits the knife-edge data and corresponds to a 2σ resolution of ∼32 μm.

    Figure 9.(a) X-ray radiograph of undriven target showing foam-filled shock tube; the CHI is obscured by the shielding. (b) Lineouts of mesh in near-axial and near-radial directions show an isotropic magnification of 17.2. (c) A Gaussian blur with a standard deviation of 11 pixels fits the knife-edge data and corresponds to a 2σ resolution of ∼32 μm.

    References

    [1] A. Thiessen, J. Nuckolls, L. Wood et al. Laser compression of matter to super-high densities: Thermonuclear (CTR) applications. Nature, 239, 139(1972).

    [2] D. T. Casey, O. A. Hurricane, D. A. Callahan et al. Fuel gain exceeding unity in an inertially confined fusion implosion. Nature, 506, 343(2014).

    [3] A. R. Miles. The blast-wave-driven instability as a vehicle for understanding supernova explosion structure. Astrophys. J., 696, 498(2009).

    [4] C. M. Huntington, H.-S. Park, C. C. Kuranz et al. How high energy fluxes may affect Rayleigh-Taylor instability growth in young supernova remnants. Nat. Commun., 9, 1564(2018).

    [5] J. J. Hester, P. A. Scowen, J. M. Stone et al. WFPC2 studies of the Crab Nebula III magnetic Rayleigh-Taylor instabilities and the origin of the filaments. Astrophys. J., 456, 225(1996).

    [6] B. I. Jun. Interaction of a pulsar wind with the expanding supernova remnant. Astrophys. J., 499, 282(1998).

    [7] J. J. Hester. The Crab Nebula: An astrophysical Chimera. Annu. Rev. Astron. Astrophys., 46, 127(2008).

    [8] G. Taylor. The instability of liquid surfaces when accelerated in a direction perpendicular to their planes I. Proc. R. Soc. London, 201, 192(1950).

    [9] R. Betti, V. N. Goncharov, R. L. McCrory et al. Growth rates of the ablative Rayleigh–Taylor instability in inertial confinement fusion. Phys. Plasmas, 5, 1446(1998).

    [10] K. Mima, H. Takabe, L. Montierth et al. Self-consistent growth rate of the Rayleigh–Taylor instability in an ablatively accelerating plasma. Phys. Fluids, 28, 3676(1985).

    [11] C. Kozma, T. K. Nymark, C. Fransson. X-ray emission from radiative shocks in type II supernovae. Astron. Astrophys., 449, 171(2006).

    [12] G. Dimonte. Spanwise homogeneous buoyancy-drag model for Rayleigh–Taylor mixing and experimental evaluation. Phys. Plasmas, 7, 2255(2000).

    [13] B.-I. Jun, J. M. Stone, M. L. Norman. A numerical study of Rayleigh-Taylor instability in magnetic fluids. Astrophys. J., 453, 332(1995).

    [14] B. K. Shivamoggi. Rayleigh-Taylor instability of a compressible plasma in a horizontal magnetic field. Z. Angew. Math. Phys., 33, 693(1982).

    [15] V. L. Trimble. Motions and structure of the filamentary envelope of the Crab Nebula(1968).

    [16] R. Bandiera, E. Amato, N. Bucciantini et al. Magnetic Rayleigh-Taylor instability for pulsar wind Nebulae in expanding supernova remnants. Astron. Astrophys., 423, 253(2004).

    [17] T. Gardiner, J. M. Stone. The magnetic Rayleigh-Taylor instability in three dimensions. Astrophys. J., 671, 1726(2007).

    [18] C. M. Huntington, M. Trantham, A. Shimony et al. Ablative stabilization of Rayleigh-Taylor instabilities resulting from a laser-driven radiative shock. Phys. Plasmas, 25, 052118(2018).

    [19] A. Casner, B. Albertazzi, G. Rigon et al. Rayleigh-Taylor instability experiments on the LULI2000 laser in scaled conditions for young supernova remnants. Phys. Rev. E, 100(2019).

    [20] F. W. Doss, J. L. Kline, K. A. Flippo et al. Development of a Big Area BackLighter for high energy density experiments. Rev. Sci. Instrum., 85, 093501(2014).

    [21] M. Koenig, S. Baton, E. Brambrink et al. Short-pulse laser-driven x-ray radiography. High Power Laser Sci. Eng., 4, e30(2016).

    [22] A. Ciardi, B. Albertazzi, J. Béard et al. Production of large volume, strongly magnetized laser-produced plasmas by use of pulsed external magnetic fields. Rev. Sci. Instrum., 84, 043505(2013).

    [23] M. G. Haines, A. Nishiguchi, T. Yabe. Nernst effect in laser-produced plasmas. Phys. Fluids, 28, 3683(1985).

    [24] M. Fatenejad, N. Flocke, P. Tzeferacos et al. FLASH MHD simulations of experiments that study shock-generated magnetic fields. High Energy Density Phys., 17, Part A, 24(2015).

    [25]

    [26] A. Bernardinello, D. Batani, J. R. Davies et al. Explanations for the observed increase in fast electron penetration in laser shock compressed materials. Phys. Rev. E, 61, 5725(2000).

    [27] T. Mattsson, M. P. Desjarlais. Phase diagram and electrical conductivity of high energy-density water from density functional theory. Phys. Rev. Lett., 97, 017801(2006).

    [28] A. B. Sefkow, C. C. Kuranz, M. J.-E. Manuel et al. Magnetized disruption of inertially confined plasma flows. Phys. Rev. Lett., 122, 225001(2019).

    [29] Apparent regions of reduced opacity at the leading edge of the flat interface is likely due to bandpass filtering, and does not hinder the ability to determine the interface location.

    [30] D. Arnett, N. C. Swisher, C. C. Kuranz et al. Rayleigh-Taylor mixing in supernova experiments. Phys. Plasmas, 22, 102707(2015).

    [31] The bright vertical lines are artifacts due to the x-ray radiography diagnostic. The initial line at 10ns is when the radiograph was taken, and subsequent lines come from reflections in the chamber propagating down the collection optics on to the streak camera.

    [32] Assuming a characteristic fluid velocity of ∼40 km/s.

    [33] B. Fryxell, C. C. Kuranz, R. P. Drake et al. The possible effects of magnetic fields on laser experiments of Rayleigh-Taylor instabilities. High Energy Density Phys., 6, 162(2010).

    [34] J. Kane, R. P. Drake, D. D. Ryutov et al. Similarity criteria for the laboratory simulation of supernova hydrodynamics. Astrophys. J., 518, 821(1999).

    [35] R. P. Drake. High-Energy-Density Physics: Foundation of Inertial Fusion and Experimental Astrophysics(2018).

    [36] R. A. Fesen, R. P. Kirshner. The Crab Nebula I. Spectrophotometry of the filaments. Astrophys. J., 258, 1(1982).

    M. J.-E. Manuel, B. Khiar, G. Rigon, B. Albertazzi, S. R. Klein, F. Kroll, F. -E. Brack, T. Michel, P. Mabey, S. Pikuz, J. C. Williams, M. Koenig, A. Casner, C. C. Kuranz. On the study of hydrodynamic instabilities in the presence of background magnetic fields in high-energy-density plasmas[J]. Matter and Radiation at Extremes, 2021, 6(2): 026904
    Download Citation