• Acta Optica Sinica
  • Vol. 43, Issue 13, 1312004 (2023)
Zhikai Yang, Zaozao Chen, Liangliang Mo, and Xinquan Zhang*
Author Affiliations
  • School of Mechanical Engineering, Shanghai Jiao Tong University, Shanghai 200240, China
  • show less
    DOI: 10.3788/AOS230469 Cite this Article Set citation alerts
    Zhikai Yang, Zaozao Chen, Liangliang Mo, Xinquan Zhang. Ultra-Precision on-Machine Measurement of Fresnel Microstructure Based on Point Autofocus Sensor[J]. Acta Optica Sinica, 2023, 43(13): 1312004 Copy Citation Text show less
    Experimental setup for on-machine measurement system
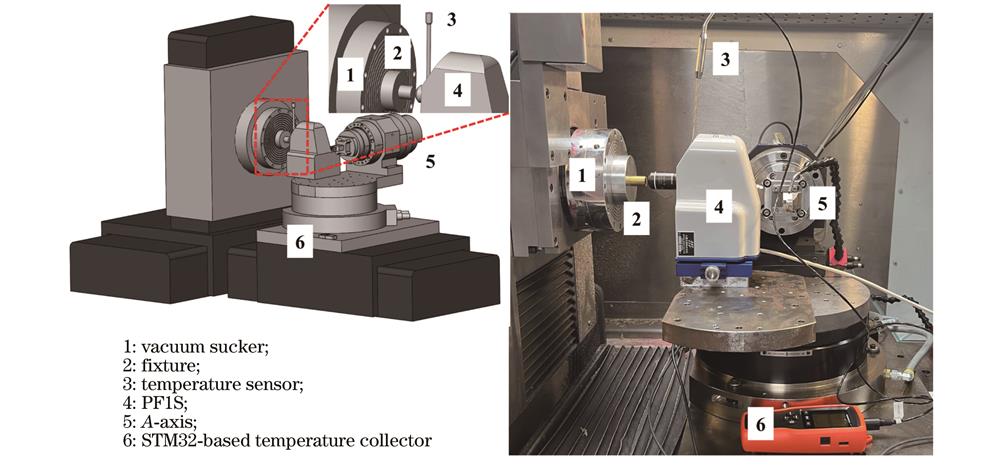
    Fig. 1. Experimental setup for on-machine measurement system
    System hardware-software framework diagram
    Fig. 2. System hardware-software framework diagram
    Schematic of point autofocus sensor. (a) Structure diagram; (b) defocus-voltage curves of the sensor[21]
    Fig. 3. Schematic of point autofocus sensor. (a) Structure diagram; (b) defocus-voltage curves of the sensor[21]
    Temperature correlation verification. (a) Schematic of the experimental process; (b) 3D measurement result of optical plane; (c) spectrum analysis results for 2D profile averaged along the scanning direction and temperature
    Fig. 4. Temperature correlation verification. (a) Schematic of the experimental process; (b) 3D measurement result of optical plane; (c) spectrum analysis results for 2D profile averaged along the scanning direction and temperature
    Schematic of coordinate system for origin calibration of the measurement system
    Fig. 5. Schematic of coordinate system for origin calibration of the measurement system
    Temperature compensation algorithm verification. (a) Original surface topography; (b) surface topography after temperature compensation; (c) comparison of mean topography along scanning direction before and after temperature compensation; (d) mean topography spectrum analysis before and after temperature compensation
    Fig. 6. Temperature compensation algorithm verification. (a) Original surface topography; (b) surface topography after temperature compensation; (c) comparison of mean topography along scanning direction before and after temperature compensation; (d) mean topography spectrum analysis before and after temperature compensation
    Measurement results of Fresnel structure. (a) Comparison of surface topography measured by conventional confocal sensor and point autofocus sensor; (b) cause analysis of central defect; (c) light intensity curve received by the equipment at the draft surface
    Fig. 7. Measurement results of Fresnel structure. (a) Comparison of surface topography measured by conventional confocal sensor and point autofocus sensor; (b) cause analysis of central defect; (c) light intensity curve received by the equipment at the draft surface
    Schematic of spherical Fresnel workpiece and error evaluation. (a) Spherical Fresnel microstructure workpiece; (b) spherical Fresnel error evaluation process
    Fig. 8. Schematic of spherical Fresnel workpiece and error evaluation. (a) Spherical Fresnel microstructure workpiece; (b) spherical Fresnel error evaluation process
    Error of Fresnel structure under different measuring equipments. (a) Offline white light interferometer; (b) offline point autofocus instrument; (c) on-machine point autofocus instrument without temperature compensation; (d) on-machine point autofocus instrument with temperature compensation
    Fig. 9. Error of Fresnel structure under different measuring equipments. (a) Offline white light interferometer; (b) offline point autofocus instrument; (c) on-machine point autofocus instrument without temperature compensation; (d) on-machine point autofocus instrument with temperature compensation
    ParameterValue
    Probe modelMitaka PF1S
    Lateral measuring range100 μm
    Feed measurement range200 μm
    Movement speed0.2 mm/min
    Scanning frequency50 Hz
    Feed step1 μm
    Objective magnification100×
    Objective numerical aperture0.8
    Table 1. Parameters for temperature correlation verification
    ItemParameterSetting
    Standard sphereCalibrated radius39977.540 μm
    Calibrated length10000.000 μm
    Scanning pathScanning times10
    X-axis offset interval500.000 μm
    Z-axis offset interval100.000 μm
    Probe settingScanning frequency50 Hz
    Optimization settingMethodInterior point
    Termination tolerance on X10-50
    Termination tolerance on function10-50
    Maximum iterationsInfinite
    Table 2. Parameters for probe calibration
    ParameterInitial value of optimization

    Maximum

    deviation

    (0,0)(100,100)(100,-100)(-100,-100)
    xR0 /μm82.3716681.9313181.6681080.274212.09745
    yR0 /μm-289.60924-287.37639-303.12874-283.2434119.88533
    zR0 /μm40434.6924940434.6805840434.5347940434.612100.15771
    u-0.00017-0.000040.000210.000370.00054
    v0.003100.00797-0.026070.018750.04482
    w1.000000.999970.999660.999820.00034
    Δx /μm193.85000193.60421-195.46880-193.02804389.31880
    Δy /μm-206.61631-206.85537205.38973207.46654414.32191
    Table 3. Optimization initial value and corresponding results for original optimization equation
    ParameterInitial value of optimization

    Maximum

    deviation

    (0,0)(100,100)(100,-100)(-100,-100)
    xR0 /μm82.8988382.3630482.6802382.637380.53579
    yR0 /μm-292.09877-289.60783-291.52141-291.726332.49094
    zR0 /μm40434.6914640434.6923540434.6961540434.694420.00469
    u-0.00016-0.00017-0.00023-0.000240.00008
    v-0.003700.00317-0.00196-0.001640.00687
    w0.999990.999991.000001.000000.00001
    ρ0 /μm283.34333283.31593283.32717283.321350.02740
    φ0 /(°)-46.71952-46.82735-46.74763-46.757930.10783
    Table 4. Optimization initial value and corresponding results for optimization equation proposed in this work
    Zhikai Yang, Zaozao Chen, Liangliang Mo, Xinquan Zhang. Ultra-Precision on-Machine Measurement of Fresnel Microstructure Based on Point Autofocus Sensor[J]. Acta Optica Sinica, 2023, 43(13): 1312004
    Download Citation