
Cheng-Zhe Chai, Zhen Shen, Yan-Lei Zhang, Hao-Qi Zhao, Guang-Can Guo, Chang-Ling Zou, Chun-Hua Dong. Single-sideband microwave-to-optical conversion in high-Q ferrimagnetic microspheres[J]. Photonics Research, 2022, 10(3): 820
- Photonics Research
- Vol. 10, Issue 3, 820 (2022)
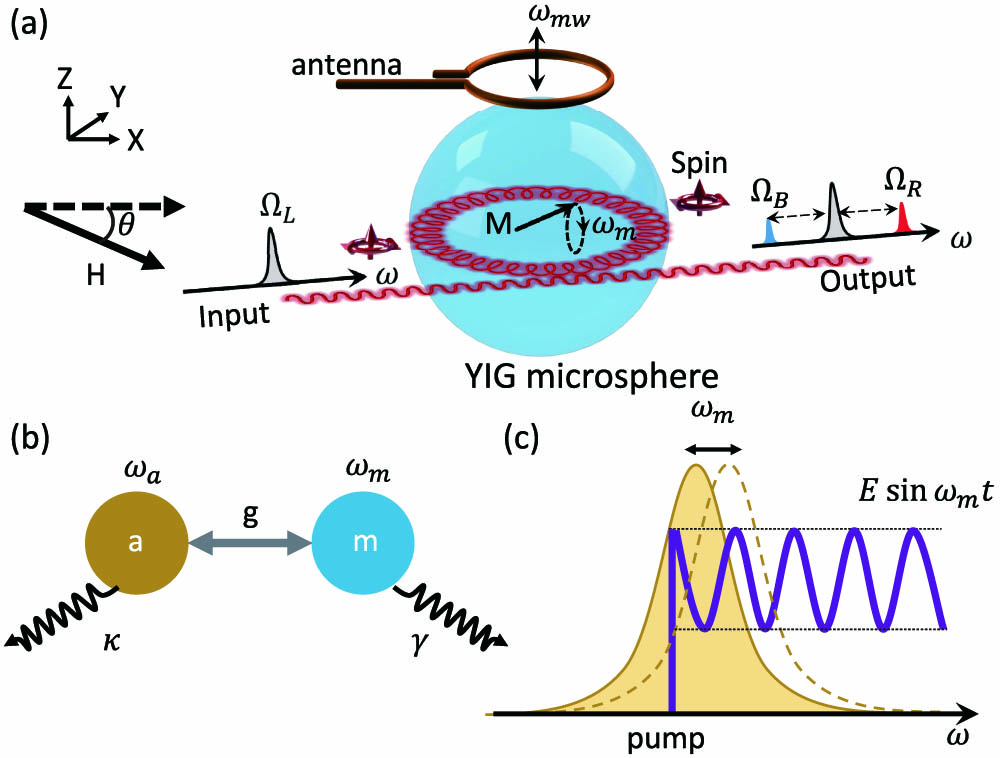
Fig. 1. (a) Schematic of the microwave-to-optical frequency conversion in a YIG microsphere. The bias magnetic field is parallel to the optical path, while the input light excites the WGMs and has an optical spin perpendicular to the propagating direction due to the spin-orbit coupling. The intracavity field could be modulated by the dynamic magnetic field via the Faraday effect, and generate two sidebands at the output port. (b) Frequency conversion via the coupling between photon (a m
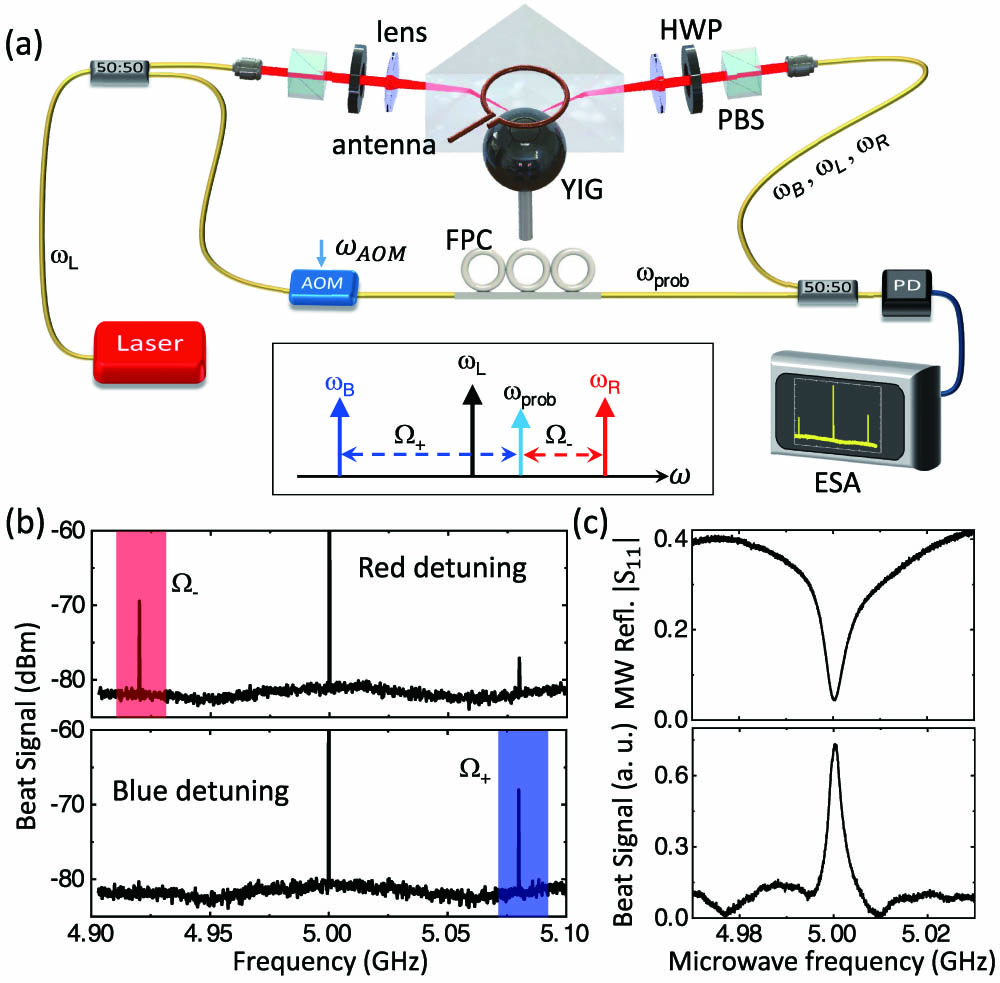
Fig. 2. (a) Schematic of the experimental setup. A tunable laser is separated into two beams by an optical fiber splitter. One beam excites the WGMs by prism coupling, which would generate two sidebands at the output, and then combines another beam as the local oscillator (LO) is shifted by an acousto-optical modulator (AOM). PBS, polarization beam splitter; HWP, half-wave plate; FPC, fiber polarization controller; PD, photon detector; ESA, electric spectrum analyzer. Inset: spectral position of the pump laser, the sidebands, and the probe laser as the local oscillator. (b) The detected beat signal when the optical pump is at red and blue detunings, respectively. The Ω − ( Ω + )
Fig. 3. (a), (b) Optical pump transmission and the generated optical signal as a function of the pump laser frequency. The experimental results agree well with the numerical calculations. (c) Transmission as a function of the input light frequency with different bias magnetic field direction. (d) The frequency shift and linewidth of the optical mode as a function of the bias magnetic field direction from (c). (e) Ω − / Ω +
Fig. 4. Converted signal as a function of the pump laser frequency detuning with different magnon frequencies by changing the magnetic field.
Fig. 5. Typical transmission of the YIG microcavity with TE and TM modes via prism coupling.
Fig. 6. Transmission as a function of the input light frequency with different bias magnetic field strength.
Fig. 7. (a)–(c) Transmission and the generated optical signal as a function of the optical pump laser detuning at various optical modes in one optical FSR. The target optical modes show the great change of transmission when the magnetic field intensity is zero (the bottom line) and H S
Fig. 8. (a) Sideband signal measured in a Fabry–Perót cavity. (b) Converted optical signal change with microwave power.

Set citation alerts for the article
Please enter your email address
© Copyright 2018-2021 | Chinese Laser Press. All Rights Reserved 沪ICP备15018463号-20