
Fengyuan Tian, Mingquan Zhou, Feng Yan, Li Fan, Guohua Geng. Spinal CT Segmentation Based on AttentionNet and DenseUnet[J]. Laser & Optoelectronics Progress, 2020, 57(20): 201008
- Laser & Optoelectronics Progress
- Vol. 57, Issue 20, 201008 (2020)
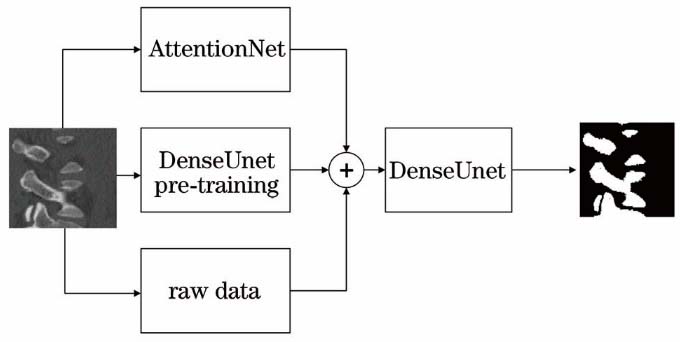
Fig. 1. Diagram of multi-channel splicing structure
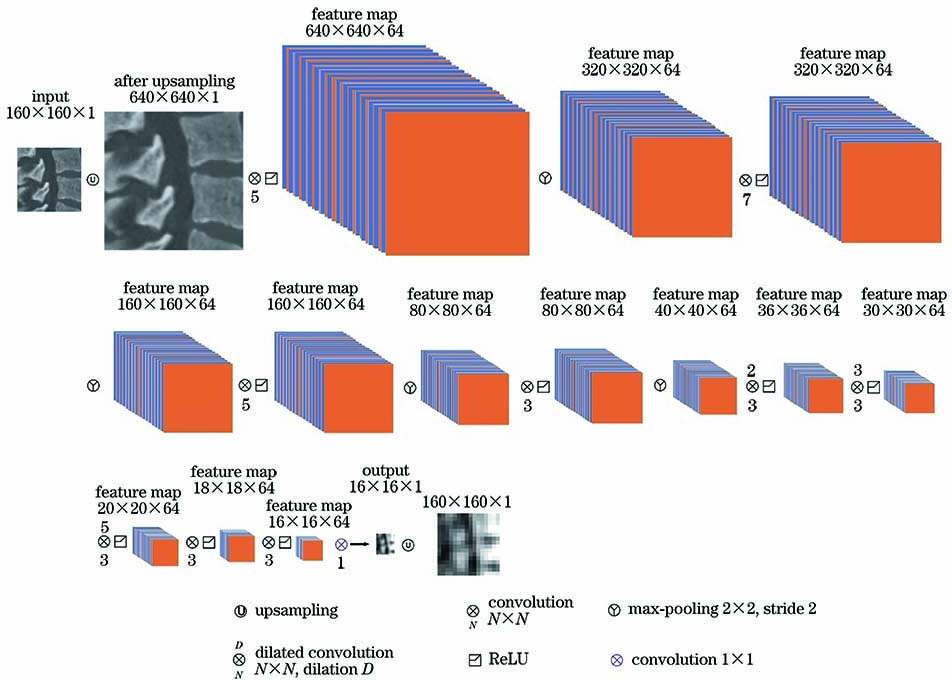
Fig. 2. Structure of AttentionNet
Fig. 3. Mapping relationship between label and mapping graph
Fig. 4. Structure of Dense block
Fig. 5. Structure of DenseUnet
Fig. 6. Relationship between accuracy, loss value, and iterations of different networks on validation set. (a) Relationship between iterations and accuracy; (b) relationship between iterations and loss value
Fig. 7. Error analysis diagram
Fig. 8. Error analysis diagram of four training samples
Fig. 9. Test sample 03_365_2. (a) Raw data; (b) label; (c) pre-trained prediction map; (d) segmentation result of Dense_end
Fig. 10. Image data and location pixel distribution infographic. (a) Original image; (b) location pixel distribution infographic
Fig. 11. Segmentation effect of traditional DenseUnet and proposed method. (a) Original image; (b) label; (c) traditional DenseUnet; (d)proposed method
|
Table 1. Segmentation results of Unet and traditional DenseUnetunit: %
|
Table 2. Number of parameters of different networks
|
Table 3. Comparison of segmentation results of different training samplesunit: %

Set citation alerts for the article
Please enter your email address
© Copyright 2018-2021 | Chinese Laser Press. All Rights Reserved 沪ICP备15018463号-20