
Zhaoji Yang, Weili Zhang, Rui Ma, Xiang Dong, Sofie Lindskov Hansen, Xiaofeng Li, Yunjiang Rao. Nanoparticle mediated microcavity random laser[J]. Photonics Research, 2017, 5(6): 557
- Photonics Research
- Vol. 5, Issue 6, 557 (2017)
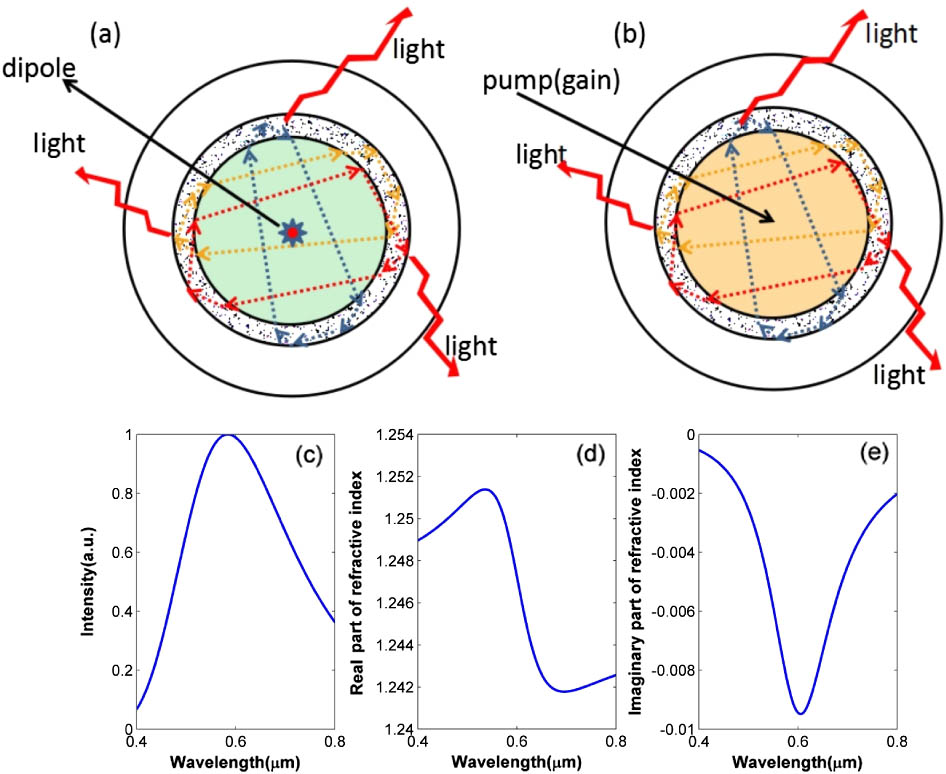
Fig. 1. Sketch of the proposed structure. (a) Cold cavity. (b) Cavity with gain. (c) Emission spectrum of the dipole source. (d) Real part of refractive index of the gain region. (e) Imaginary part of refractive index of the gain region.
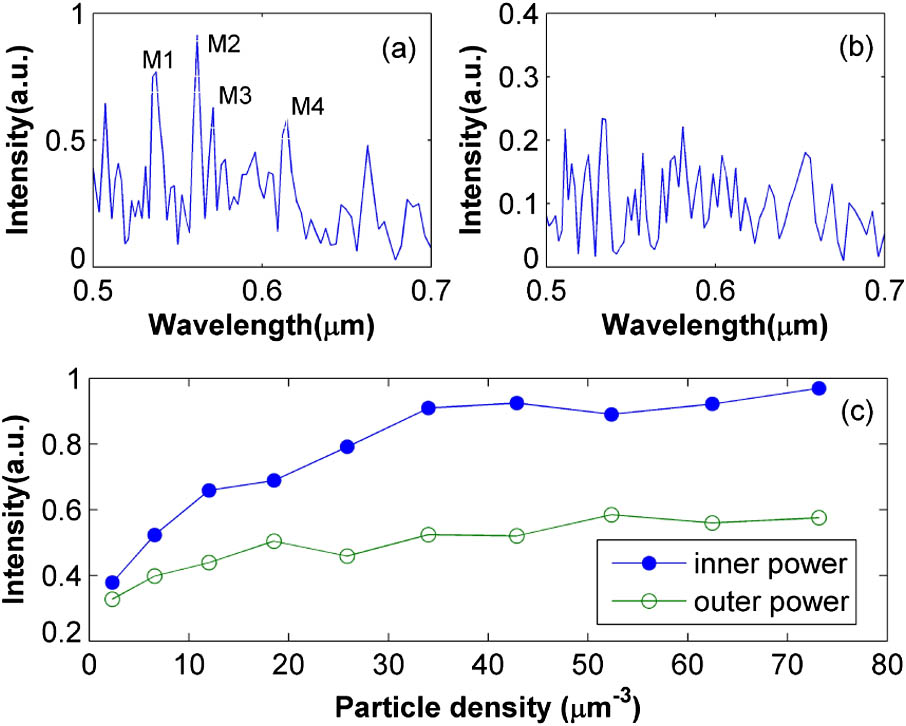
Fig. 2. Output spectrum and integrated intensity of the laser from cold cavity analysis. In (a) and (b), the density of scatters is 2.3 and 73.1 μm − 3
Fig. 3. Intensity distribution for different resonance modes from cold cavity analysis; (a)–(d) correspond to mode resonance wavelength of 0.537, 0.562, 0.571, and 0.615 μm, respectively, as M1–M4 marked in Fig. 2(a) .
Fig. 4. Lasing spectra from four different monitoring positions; (a)–(d) correspond to the monitor position of C1–C4, respectively. Taking center of the core as origin of coordinate, positions of C1–C4 are (0 μm, 6 μm), (6 μm, 0 μm), (0 μm, 6 μm), and (− 6 μm
Fig. 5. Output of the laser with an inserted nanoparticle. (a), (c), and (e) are the spectra; (b), (d), and (f) are the intensity distribution for the nanoparticle sited at positions (0 μm, 5 μm), (5 μm, 0 μm), and (2.5 μm, 2.5 μm); (g)/(h) is the mapping of peak intensity/wavelength of output when position of the inserted nanoparticle varies.

Set citation alerts for the article
Please enter your email address
© Copyright 2018-2021 | Chinese Laser Press. All Rights Reserved 沪ICP备15018463号-20