
Jing Li, Tigang Ning, Li Pei, Jingjing Zheng, Jian Sun, Yueqin Li, Jin Yuan. Quasi-optical single-sideband modulation with continuous carrier-to-sideband ratio tunability[J]. Chinese Optics Letters, 2015, 13(8): 080606
- Chinese Optics Letters
- Vol. 13, Issue 8, 080606 (2015)
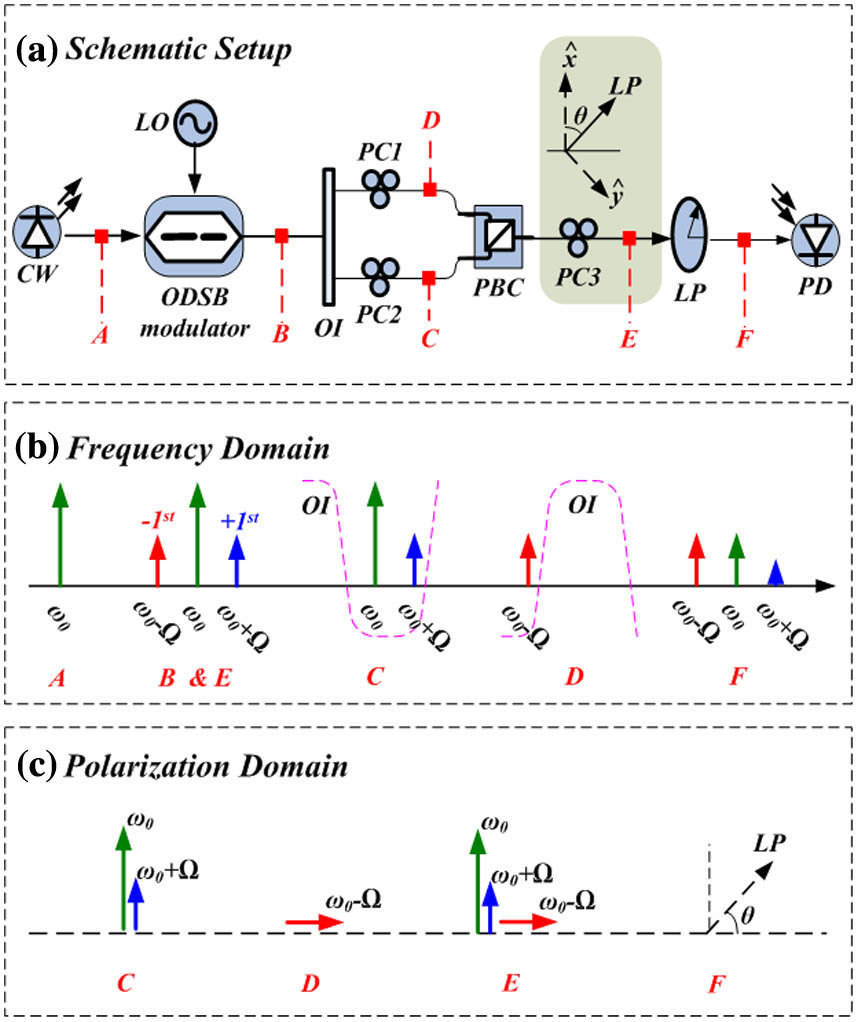
Fig. 1. (a) Schematic setup of the proposed quasi-OSSB modulation approach. (b) Illustration of the operation principle in the frequency domain. (c) Evolution of the polarization state.
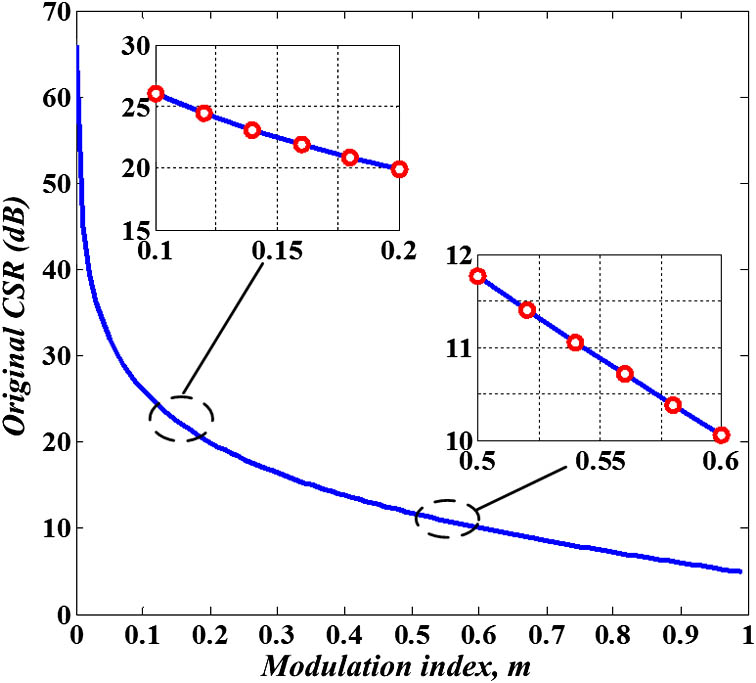
Fig. 2. The original CSR (in decibels) versus the modulation index m < 1
Fig. 3. The output CSR (in decibels) versus the polarizing angle θ m
Fig. 4. The required θ m
Fig. 5. Radio frequency power oscillation versus LUR. The insert denotes the simulated radio frequency power variation at different fiber lengths. (The radio frequency is f RF = 30 GHz D = 17 ps / km · nm α = 0.2 dB / km
Fig. 6. Spectrum response of the 50/100 GHz OI from B-C (dashed line) and from B-D (dotted line), REW = 0.01 nm
Fig. 7. (a) Optical spectra before (blue dotted line) and after (black real line) the OI (B-C) and the transmission response (red dashed line) of the OI. (b) Optical spectra before (blue dotted line) and after (black real line) the OI (B-D) and the transmission response (red dashed line) of the OI.
Fig. 8. Experimental optical spectra when CSR = 22
Fig. 9. Experimental optical spectra with different driving frequencies ƒ RF = 14
Fig. 10. Simulated radio frequency power versus CSR.
Fig. 11. Simulated BER curves and corresponding eye diagrams at BTB and 100 km SMF transmission.

Set citation alerts for the article
Please enter your email address
© Copyright 2018-2021 | Chinese Laser Press. All Rights Reserved 沪ICP备15018463号-20