A quasi-optical single-sideband (quasi-OSSB) modulation approach with a tunable carrier-to-sideband ratio (CSR) is proposed and demonstrated. By simply tuning the polarizing angle, a continuously tunable CSR can be obtained. Since the upper sideband is highly suppressed during the CSR’s tuning, quasi-OSSB modulation signals with extremely small interference are generated. An experiment is undertaken for verification. It is found that the target CSR can be continuously tuned over a wide range, which can be used to improve the receiver sensitivity of the fiber links.
Radio over fiber (RoF) has been considered as a promising technology in future broadband wireless communication[1–3]. With this technology, there are the key requirements of a reduced cell size and a decreased number of participating users in order to increase the maximum available throughput per user. Besides, an extension of the radio frequency to the millimeter-wave range can achieve a higher wireless data transmission rate[4]. By using optical fibers instead of coppers, the maximum transmission range at a given data rate could be drastically extended. However, the chromatic dispersion in analog photonic links is the primary concern. Many schemes have been proposed to solve this problem, such as using midway optical phase conjugation[5], pre-compensation in the electrical domain with phase shifting[6], carrier phase-shifted double-sideband modulation[7], and polarization modulation[8,9]. But in a practical RoF system, there are hundreds of fiber links, all of which are required to be compensated one by one. It is costly to construct and maintain such a network.
Unlike the above schemes[5–9], optical single-sideband (OSSB) modulation seems to be a good solution to remove fiber dispersion-induced power fading[10,11]. Recent research also found that with an optimum carrier-to-sideband ratio (CSR), an OSSB signal can improve the receiver sensitivity of fiber links[12–15]. There have been many reported approaches to integrating an OSSB signal with an optimum CSR. The key challenge associated with the approaches[12,13] is that an integrated modulator (a triple-arm Mach–Zehnder modulator[12] or a dual-parallel Mach–Zehnder modulator[13]) is required, and the bias-drift problem needs to be taken care of. The approaches[14,15] are simple and cost-effective. However, they all suffer from poor CSR tunability, since in most cases, the property of the fiber grating is fixed.
In this work, we report a quasi-OSSB modulation approach with a tunable CSR. The prototype is based on polarization multiplication architecture. By adjusting the polarization angle of the linear polarizer (LP), the CSR of the quasi-OSSB signals can be continuously tuned. Thanks to the small signal modulation, the undesired sideband of the quasi-OSSB signals will be suppressed when the CSR is tuned to its optimum value. Thus, no further procedure is required to deal with the issue of radio frequency power oscillation. The scheme is first analyzed in theory and then verified by experiment. Data transmission via a long-distance fiber link is also implemented.
Sign up for Chinese Optics Letters TOC. Get the latest issue of Chinese Optics Letters delivered right to you!Sign up now
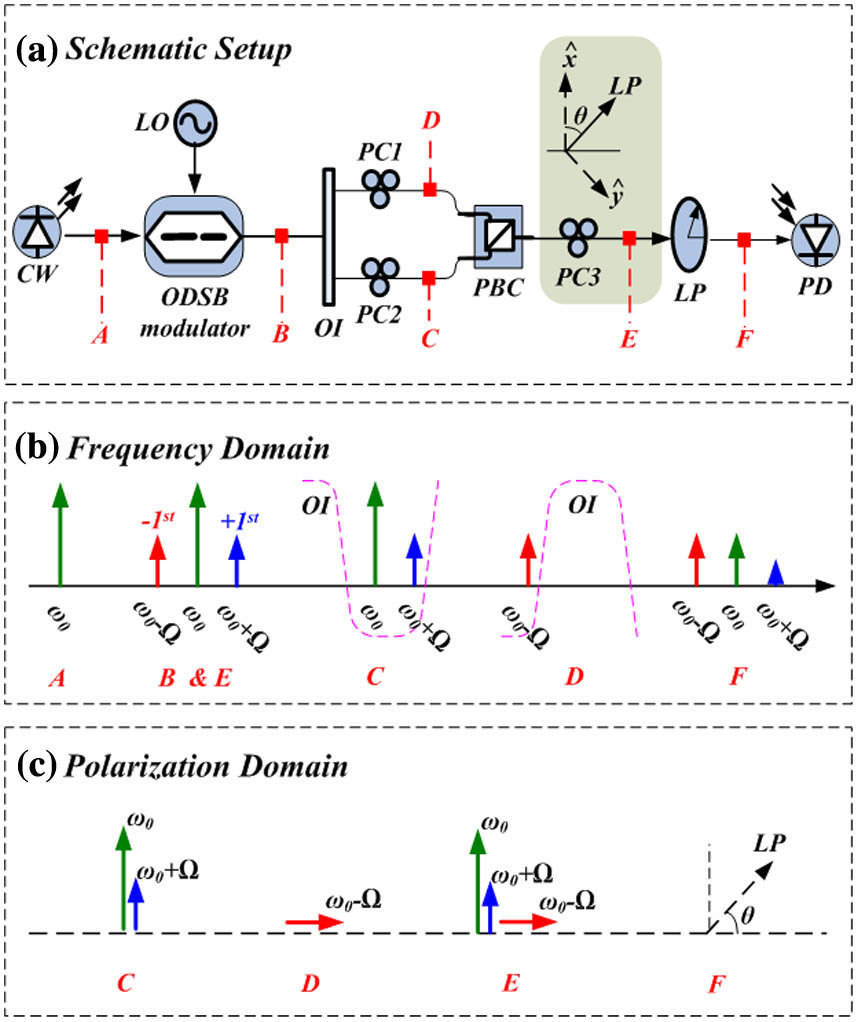
The schematic setup of the proposed quasi-OSSB modulation approach is shown in Fig. 1. A continuous-wave (CW) laser serves as the optical source. The lightwave is then coupled into a modulator. The modulator is then driven by a radio frequency signal as , where and represent the magnitude and angular frequency of . Under a small signal modulation, the impact of the higher-order harmonic is negligible. Thus, the output optical field after modulation can be concluded as: where is the magnitude of the optical carriers, is the angular frequency of the optical carriers, is the Bessel function of the first kind of order , and is the modulation index, where denotes the half-wave voltage of the modulator.
Figure 1.(a) Schematic setup of the proposed quasi-OSSB modulation approach. (b) Illustration of the operation principle in the frequency domain. (c) Evolution of the polarization state.
Thus, the relationship between the original CSR (in decibels) and the modulation index is shown in Fig. 2. Note that at different values of , the original CSR varies. In the practical case, small signal modulation is always preferred. The direct consequence of a small is that the original CSR becomes too high, which means the optical carrier occupies too much power. It will lead to undesired high power consumption in the fiber link.
Figure 2.The original CSR (in decibels) versus the modulation index .
Our work focuses on a filtering technique with a tunable CSR. As shown in Fig. 1(a), the optical double-sideband (ODSB) signal (point B) is first coupled into a 50/100 GHz optical interleaver (OI). With the proper setting of CW central wavelength, the three subcarriers in Eq. (1) are separated into two paths: one (from point B to point D) with the lower sideband (1st order), and the other (from point B to point C) with the optical carrier and upper sideband (1st order). By using a polarization beam combiner (PBC), different frequency components are polarization multiplexed. In the polarization domain [see Fig. 1(c)], the lower sideband is at the slow axis of the PBC, the optical carrier, and the upper sideband at the fast axis . The optical field (point E) can be simply expressed as:
In the next step, a LP that has its principle polarization direction relative to is employed. The optical field becomes
Substituting Eq. (3) into Eq. (4), it can be rewritten as
Considering the polarizing angle with a range of 0°–45°, the output CSR can be calculated as
For a given value of , the output CSR is dependent on the polarizing angle only. To investigate the CSR’s tunablity, Fig. 3 plots the curves between CSR and at different values of . When considering the case of one subcarrier modulation , the optimum CSR is 0 dB[12–15]. To obtain 0 dB CSR, is predicted to be around 3° at . When is increased from 0.1 to 0.2, 0.5, or 1, is supposed to adjust to 6°, 14°, or 24° (as shown in the insert in Fig. 2). Figure 4 plots the required (left axis) and LUR versus (when 0 dB CSR is guaranteed). Here, LUR is defined as the power ratio between the lower and upper sideband, which can be used to evaluate the property of a quasi-OSSB signal. Normally, when the LUR is pretty high (, for example), the impact of the undesired sideband is small . The signals can be considered as OSSB modulations. Figure 5 shows the relationship between the LUR and the radio frequency power oscillation after long-distance fiber transmission. The power oscillation can be estimated as shown in the figure’s insert. Note that the simulated power oscillation is around 1.8 dB at , which is small in practical use.
Figure 3.The output CSR (in decibels) versus the polarizing angle at different modulation indexes .
Figure 5.Radio frequency power oscillation versus LUR. The insert denotes the simulated radio frequency power variation at different fiber lengths. (The radio frequency is , the fiber dispersion index is , and the attenuation factor is .)
To investigate its mechanism, an experiment is performed. The setup can be found in Fig. 1. The tunable CW laser (Agilent 8164A) works at a carrier wavelength of 1549.93 nm and a power of 6 dBm. The lightwave is then coupled into a Mach–Zehnder modulator (Fujitsu FTM7962EP) for ODSB modulation. This modulator is characterized by its dual-parallel structure and a relatively large bias half-wave voltage (around 12 V). To obtain ODSB modulation, the lower path of the modulator is terminated. As for the upper path, the modulator is operated at a quadrature point (bias voltage of 6 V). The signal generator (Hewlett 83711B) generates an 18 GHz sinusoid signal as the radio frequency driving signal. Then, a 50/100 GHz OI is used to separate the lightwave. The spectrum response of the OI is then measured by an optical spectrum analyzer (Ando AQ6317C), as shown in Fig. 6. The symbols B-C and B-D denote the response from point B to C (in Fig. 1) and point B to D (in Fig. 1). The channel isolation can be figured as being around 40 dB. The reference power level of Fig. 6 is dependent on the output power of the broadband amplified spontaneous emission source (SuperK). In our setup, the function of the OI is to separate the lower sideband from the ODSB signals. Figure 7(a) plots the optical spectra before (dotted line) and after (dashed line) the OI (B-C). As shown in the figure (blue dotted line), the original CSR is around 28 dB, which corresponds to , according to Fig. 2. The dashed line denotes the spectra after the OI. Due to the slow-changing response and finite channel isolation of the OI, the optical carrier cannot be fully suppressed. As to the upper sideband (st order), it has already been merged by the noise floor. Figure 7(b) represents the results before and after the OI (B-D).
Figure 6.Spectrum response of the 50/100 GHz OI from B-C (dashed line) and from B-D (dotted line), .
Figure 7.(a) Optical spectra before (blue dotted line) and after (black real line) the OI (B-C) and the transmission response (red dashed line) of the OI. (b) Optical spectra before (blue dotted line) and after (black real line) the OI (B-D) and the transmission response (red dashed line) of the OI.
After combination of the PBC, three subcarriers of the ODSB signals are allocated with orthogonal polarizations (i.e., the lower sideband at the slow axis of the PBC, the optical carrier, and the upper sideband at the fast axis ). Then, the polarization-multiplexed signal is made linear by a LP. As a proof-of-concept experiment, not all of components are polarization maintained. In order to avoid polarization turbulence, all components (including the cables) from Port B to Port F (in Fig. 1) are fixed at the shockproof platform in the experiment. The polarizing angle can be controlled by aligning PC3 between PBC and LP. Thus, the output CSR can be tuned by varying . Figure 8 illustrates the optical spectra with different CSRs. For instance, the CSR can be tuned to 22, 18, 9.5, 3.5, and 0 dB if the polarizing angle is aligned to the right angle (as shown in Fig. 3). Note that at 22 and 18 dB, the CSR at the upper sideband still exists in the spectra. The signal can be considered to be a quasi-OSSB signal.
Figure 8.Experimental optical spectra when , 18, 9.5, 3.5, and 0 dB.
If we consider one radio frequency tone modulation, we may fix the CSR to its optimum value, 0 dB[12–15]. By simply tuning the driving frequency from 14 to 20 GHz, the optical spectra can be found, as shown in Fig. 9. It must be mentioned that at different driving frequencies, the polarizing angle needs a slight re-adjustment. There are two primary reasons for this: 1) The imperfect response of the OI. At a lower frequency band, the frequency selectivity of the OI is poor; 2) the limited bandwidth of the electrical amplifier and modulator. They will result in a different modulation index , which will also affect the original CSR. Thanks to the CSR’s tunability, we can always obtain an optimum CSR by adjusting the polarizing angle.
Figure 9.Experimental optical spectra with different driving frequencies , 16, 18, and 20 GHz.
To evaluate the transmission performance, data modulation is applied. The following part is carried out by simulation via Opti-System 10.0. The major setup can be found in Fig. 1. As to the transmitted data, it is generated by mixing a 512 Mb/s pseudo-random bit sequence with the radio frequency subcarrier (20 GHz, for example) using an electrical mixer. In the simulation setup, the CW laser is operated at a wavelength of 1549.93 nm and a power of 10 dBm. The modulation index is fixed at . In order to illustrate the relationship between the receiver sensitivity and the CSR, we using an adjustable optical amplifier to maintain the received optical power while the input of the photodiode (PD) remains constant (at 0 dB, for example). The radio frequency power versus the CSR (electrical spectra are inserted) is shown in Fig. 10. Since the bit error rate (BER) performance is highly dependent on the radio frequency power, it can be clearly observed that at 0 dB, the CSR corresponds to the best receiver sensitivity. As a comparison, the traditional ODSB modulation is also evaluated. Figure 11 plots the BER curves at back-to-back (BTB)and 100 km single-mode fiber (SMF) transmission. In order to achieve a more stable performance, the SMF is placed at point F in Fig. 1. In Fig. 11, the receiver sensitivity at for the quasi-OSSB signal is obtained at , while it degrades to around for the traditional ODSB signal (in our case, when is adjusted to 45°, we get the ODSB signal with a 21 dB CSR, as predicted in Fig. 2). The 3.9 dB power penalty is mainly due to the applied CSR, since 0 dB is the optimum value. In other words, the receiver sensitivity (at ) has been improved 3.9 dB by tuning the CSR from 21 to 0 dB. Then, in the case of the 100 km SMF transmission, similar to the case in BTB, the receiver sensitivity (at ) has been improved 7.5 dB by tuning the CSR from 21 to 0 dB, in which a 3.6 dB penalty is induced by the fiber dispersion, and a 3.9 dB penalty is induced by the incorrect CSR.
Figure 10.Simulated radio frequency power versus CSR.
In conclusion, a quasi-OSSB modulation approach is proposed and demonstrated. With careful adjustment of the polarizing angle θ, the CSR of the quasi-OSSB signal can reach its optimum value (i.e. 0, 3, or 6 dB). It is found that under small signal modulation ( for example) the impact of the upper sideband is less than 1% (LUR ). The mechanism is demonstrated by a proof-of-concept experiment. Under small signal modulation, the CSR can be continuously tuned over a wide range. It has to be mentioned that the operation frequency is dependent on OI spectrum response. In order to achieve a high frequency band (millimeter-wave or terahertz), it should be specially designed.
References
[1] Y. Yu, X. Zheng, H. Zhang, B. Zhou. Chin. Opt. Lett., 11, 120601(2013).