• Laser & Optoelectronics Progress
  • Vol. 59, Issue 3, 0307001 (2022)
Fengbo Zhou1、3、*, Hongqiu Zhu2, and Changgeng Li3、**
Author Affiliations
  • 1School of Information Engineering, Shaoyang University, Shaoyang , Hunan 422000, China
  • 2School of Automation, Central South University, Changsha , Hunan 410083, China
  • 3School of Physics and Electronics, Central South University, Changsha , Hunan 410083, China
  • show less
    DOI: 10.3788/LOP202259.0307001 Cite this Article Set citation alerts
    Fengbo Zhou, Hongqiu Zhu, Changgeng Li. Optical System Error Correction Method for Online Detection of Miniature Spectrometer[J]. Laser & Optoelectronics Progress, 2022, 59(3): 0307001 Copy Citation Text show less
    Flow chart of adaptive wavelet threshold algorithm
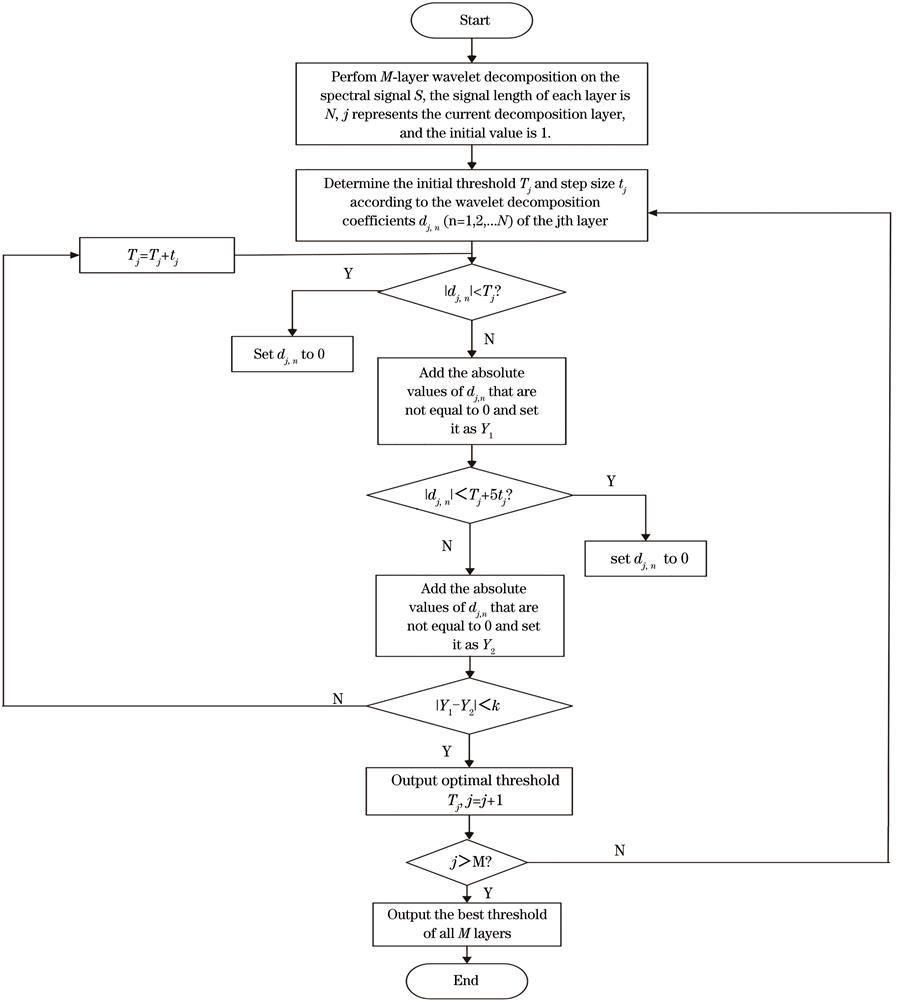
    Fig. 1. Flow chart of adaptive wavelet threshold algorithm
    Spectral detection hardware platform
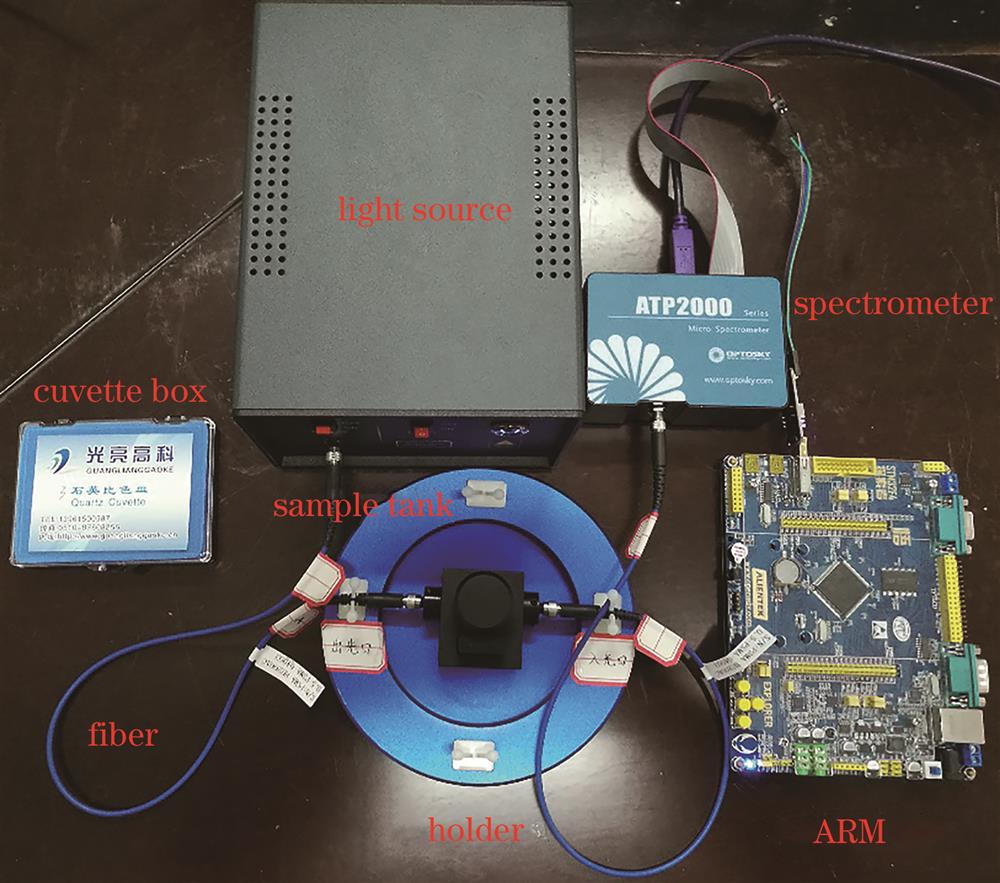
    Fig. 2. Spectral detection hardware platform
    Copper spectral signal collected by ATP2000 spectrometer. (a) Background light intensity; (b) reference light intensity; (c) sample light intensity; (d) absorbance curve
    Fig. 3. Copper spectral signal collected by ATP2000 spectrometer. (a) Background light intensity; (b) reference light intensity; (c) sample light intensity; (d) absorbance curve
    Spectral signal and calibration curve of copper and cobalt. (a) Spectral signal of copper; (b) spectral signal of cobalt; (c) linear correction curve of copper; (d) linear correction curve of cobalt
    Fig. 4. Spectral signal and calibration curve of copper and cobalt. (a) Spectral signal of copper; (b) spectral signal of cobalt; (c) linear correction curve of copper; (d) linear correction curve of cobalt
    Spectral signal and calibration curve of copper and cobalt after denoising. (a) Spectral signal of copper; (b) spectral signal of cobalt; (c) linear correction curve of copper; (d) linear correction curve of cobalt
    Fig. 5. Spectral signal and calibration curve of copper and cobalt after denoising. (a) Spectral signal of copper; (b) spectral signal of cobalt; (c) linear correction curve of copper; (d) linear correction curve of cobalt
    Ratio curve of dual wavelength intensity. (a) Ratio curve at the wavelengths of 445 nm and 525 nm; (b) ratio curve at the wavelengths of 456 nm and 492 nm
    Fig. 6. Ratio curve of dual wavelength intensity. (a) Ratio curve at the wavelengths of 445 nm and 525 nm; (b) ratio curve at the wavelengths of 456 nm and 492 nm
    Spectral signal calibration curve
    Fig. 7. Spectral signal calibration curve
    Wavelength /nmCorrelation coefficient of original spectral signalCorrelation coefficient after correction processing
    CuCoCuCo
    373.350.51230.62410.55150.6634
    415.820.57080.86670.68440.9227
    447.570.50040.58150.70020.6943
    492.340.98130.97650.99470.9922
    517.410.97360.97880.99360.9959
    543.730.98310.98660.99250.9934
    Table 1. Linear correlation parameters of copper and cobalt at different wavelengths
    Fengbo Zhou, Hongqiu Zhu, Changgeng Li. Optical System Error Correction Method for Online Detection of Miniature Spectrometer[J]. Laser & Optoelectronics Progress, 2022, 59(3): 0307001
    Download Citation