Ru-Tai CHEN, Sheng YU. Theoretical study and PIC simulation of a 220 GHz Gyro-TWT with periodic dielectric loaded waveguide[J]. Journal of Infrared and Millimeter Waves, 2022, 41(6): 1042
Copy Citation Text
In this article, a 220 GHz gyro-TWT operating at fundamental harmonic TE01 mode with periodic dielectric loaded (PDL) waveguide was designed through theoretical study and particle in cell (PIC) simulation. The parasitic oscillations (absolute instability oscillation and backward wave oscillation) have been successfully suppressed by study of start-up thresholds and loading dielectric rings. The beam wave interaction behaviors are compared between nonlinear theory programs and PIC simulation, the results are basically consistent. In PIC simulation, the optimized gyro-TWT was developed with saturated output power of 55.61 kW, corresponding efficiency of 26.48% at 220 GHz with 70 kV and 3A electron beam, the saturated gain is 53.56 dB, and -3dB bandwidth is 12 GHz.
Gyrotron traveling wave tube(Gyro-TWT)is a kind of relativistic nonlinear vacuum electric device that can generate high power,high gain and wideband in microwave,millimeter wave and terahertz wave band. It has broad application prospects in high resolution radar,high speed communication,electric countermeasure etc.,and attracted the attention of many research institutions [1-2]. High frequency interaction structure is one of the core components in Gyro-TWT,where is the mainly place that process the beam-wave interaction and possible to occur the parasitic oscillations(absolute instability oscillation and backward wave oscillation). In early stage,the interaction structure usually is smooth waveguide,where the parasitic oscillations are easily to happen and seriously affect the performance of Gyro-TWT[2-3]. For suppressing of parasitic oscillations,the interaction structure has evolved into many improved structures. In 1990s,the National Tsinghua University(NTHU)has developed an ultrahigh gain ka-band Gyro-TWT with distributed loss loading circuit,the saturated peak power is 93 kW with 26.6% efficiency,70 dB gain and -3 dB bandwidth of 3 GHz [4]. As this report published,the Gyro-TWT has entered the rapid development era. In 2014,the University of electronic science and technology of China(UESTC)has tested a W-band with a nonuniform periodic dielectric loaded waveguide gyro-TWT,the peak output power is 112kW with efficiency of 23.3% at 93.5 GHz,and the bandwidth of greater than 90kW is about 4 GHz [5]. In the process of developing towards higher frequency band,in 2003,the Massachusetts Institute of Technology(MIT)has reported a 140 GHz confocal Gyro-TWT,with the mode selective circuit,the pulsed power is up to 30kW with an efficiency of 12%,a gain of 29 dB and bandwidth of 2.3 GHz [6]. In 2017,MIT also has reported a 250 GHz photonic-band-gap gyro-TWT with picosecond pulses,a circuit gain of more than 55 dB and a wide operational bandwidth of 16 GHz are observed [7]. Besides,a 220 GHz confocal gyro-TWT with two lossy severs is designed in UESTC,peak output power reaches 10.7kW with a efficiency of 11.65%,a peak gain of 25.5 dB and 1 dB bandwidth of 2.3 GHz [8]. In 2019,the National University of Defense Technology has reported a 220 GHz second harmonic confocal gyro-TWT with an output power of 4.55 W,the efficiency of 2.2%,gain of 21.8 dB and the -3 dB bandwidth of 6 GHz [9]. Of course,PDL interaction structure still is the most matured and effective interaction circuit,which has been chosen to design the 220 GHz gyro-TWT [10-12].
In this article,a fundamental harmonic mode 220 GHz gyro-TWT is designed through theoretical study and PIC simulation. For suppressing of potential parasitic oscillations,the start-up thresholds are analyzed in detail and compared with PIC simulation results. By the theoretical analyses,the interaction circuit preliminary operating parameters were obtained. To get more accurate results,the designed Gyro-TWT also was simulated in 3D-PIC(CST)simulation software. The organization of this article as follows:Section II,the parasitic oscillations of interaction circuit are introduced,linear and nonlinear theory are used to obtain the initial operating parameters. Section III,the PIC simulation results of the present PDL gyro-TWT are described and compared with theoretical studies.
1 Beam-wave interaction theoretical study
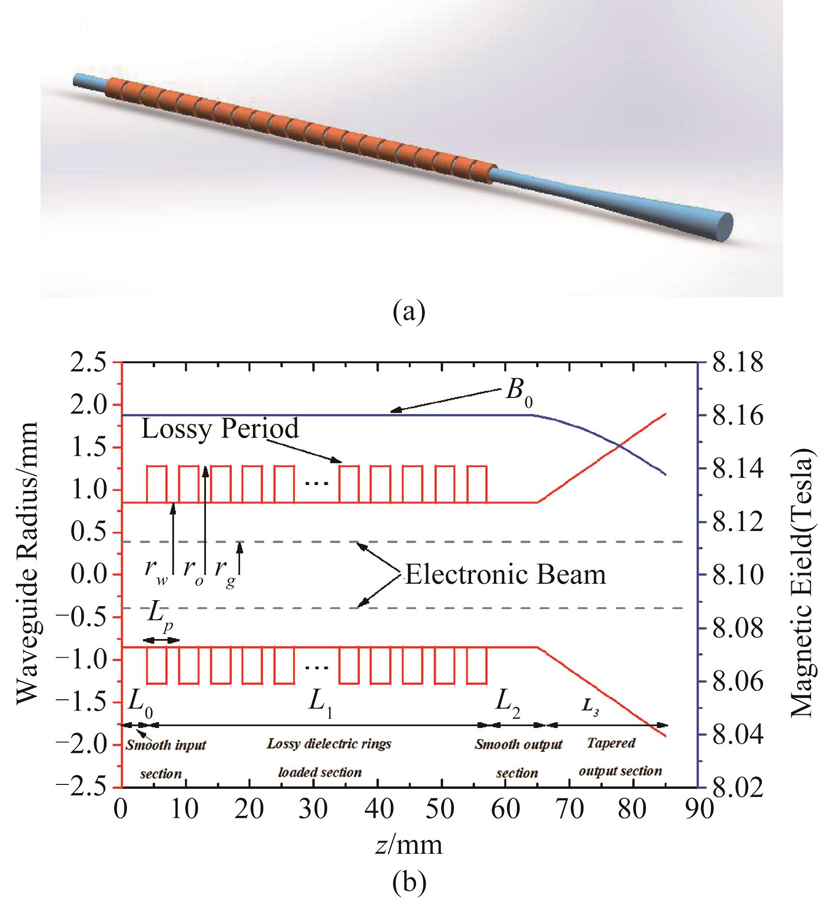
The 220 GHz Gyro-TWT beam-wave interaction circuit schematic is shown in Fig. 1. As a periodic dielectric loaded(PDL)interaction circuit is usually combined with four parts,smooth input section,lossy dielectric rings loaded section,smooth output section and tapered output section,respectively. The detailed theoretical analyses,and design of the interaction structure are discussed in this section.
Figure 1.Beam-wave interaction circuit configurations of the 220 GHz Gyro-TWT (a) The 3-D structure diagram, (b) the interaction circuit schematic
As the main factor limiting the development of Gyro-TWT,the parasitic oscillations of interaction circuit prime are absolute instability oscillation and backward wave oscillation(BWO). As the electron beam of Gyro-TWT is working on the weakly relativistic situation,and for getting high gain,the working area always is chosen near the grazing point,as the red circular area in Fig. 2,named convective instability area. But when the working current increase to a certain value(oscillation start-up current),the working area will extend to the negative area of wave number. And then,the absolute instability oscillation has occurred. For backward wave oscillation,when the electron cyclotron resonance curve intersects the waveguide mode dispersion curve in the negative wave number area. In this area,the phase and group velocity of the electromagnetic wave are negative,the angular frequency of electron and wave are quite closed. When the backward wave and the forward moving electron meet together,and if the current or interaction waveguide length bigger than the start oscillation threshold,the operating conditions will satisfy the needs of backward wave oscillation,there will generate the energy feedback loop in the interaction structure,and the backward wave oscillation is formed. In Fig. 2,when the mode as the operating mode,two electron cyclotron resonance curves(,)have intersected with mode(,,)dispersion curve in the negative wave number area(Point A,B,C in Fig. 2),where maybe occur the BWO.
Figure 2.Dispersion diagram of 220 GHz PDL Gyro-TWT,(,beam velocity pitch factor ,magnetic detuning ratio . Point A,B,C are backward wave oscillation points. The red circular area is convective instability area)
For the suppressing of BWO and absolutely instability oscillation,reducing of operating current and pitch ratio,increasing of magnetic detuning ratio both are effective. And the detailed analyses will be presented in the below.
1.2 Linear theory analysis
In general,Gyro-TWT operates at fundamental mode,which can lead the device to operate in low mode density conditions,and directly reduce the occurrence of parasitic oscillations. Meantime,as the operating frequency increases,the size of the interaction waveguide decreases accordingly. So,in this paper,the operating mode of 220 GHz Gyro-TWT is set as ,and the waveguide radius is 0.85 mm. Besides,a high alpha value can improve the efficiency,but also is a serious challenge for the design of the MIG,which usually comes with larger velocity spread problems. So,the electron beam velocity ratio(alpha)is set to be 1.2 in our design.
Based on the linearized Vlasov-Maxwell equation and the plasma kinetic model,the linear theory has been derived. And taking the lossy loading into consideration. The small- signal dispersion equation of dielectric-loaded cylindrical waveguide Gyro-TWT can be written as [3-4]:
,
where is the wave angular frequency, is the light speed in the vacuum, is the axial propagation wave number, is the cutting off wave number, is the nth root of mth Bessel function, is the Alfven current,,,,,,, and represent the waveguide radius,the electron Lamer radius,the electron beam guiding radius,the electron axial velocity,the electron orbital velocity normalized to ,the skin depth of loaded waveguide,the cyclotron harmonic number,and the non-relativistic electron cyclotron frequency,respectively. And the other parameters are defined as:
,
,
The Eq. 3, can be used to describe the electron beam and wave mode coupling coefficient. Figure 3 is the relationship between the coupling coefficient factor and normalized guiding radius. We can see that the mode coupling factor always maintain the advantage over the whole radius area. It means that the backward wave oscillation of mode is quite likely to occur,which needs to be suppressed more carefully. And when the operating mode gets the biggest coupling factor,but mode factor also is very closed. In order to avoid the potential parasitic oscillation. A guiding center radius of was selected.
Figure 3.The coupling coefficient of 220 GHz PDL Gyro-TWT versus normalized guide center radius
Figure 4(a)shows the changing of absolute oscillation start current with ,in a losses circuit. When and the start current is 6.6 A. For the stable operation of the device,away from the start current threshold,3 A is chosen as the operating current. Figure 4(b)is the start current of absolute oscillation of lossy circuit,it’s clearly,when increases,the start current decreases gradually. And,with the dielectric conductance decreasing,the start current also increases significantly.
Figure 4.The start current of absolute instability oscillation , (a) losses circuit with different , (b) lossy circuit with different conductance
In addition to the absolute oscillation,the backward wave oscillation is another kind of parasitic oscillation which is also seriously impacts the device’s performance. For analysis of this kind of oscillation,applying the Laplace transformation to solve the Valsov-Maxwell equation [3-4],the longitudinal field amplitude can be acquired. Figure 5(a)shows the start length of three potential backward wave oscillations with their related oscillation frequency,in the losses circuit. When the operation current is set as 3 A,the most easily oscillate mode is with the start length is 9.89 mm,and the corresponding oscillation frequency is 186.155 GHz, with start length 12.81mm at 394.84 GHz and with start length 15.94 mm at 166.78 GHz. It means that the nonlinear stage should be smaller than 9.89mm to avoid the backward wave oscillation. In Fig. 5(b),the relationship between start length with conductance()is given. In order to ensure that the interaction gain is significantly large,the circuit length should be enough long. As the estimated whole length of the circuit is about ,and the corresponding conductance threshold is . To ensure oscillations do not occur,finally,the lossy dielectric conductance is set as .
Figure 5.The start length of backward wave oscillations with voltage and current , (a) longitudinal field profiles in losses circuit, (b) start length changing versus different conductance
As a quartic polynomial,the dispersion Eq.1 has four roots. Which are related to four traveling waves,growing wave,decaying wave,forward constant amplitude wave,and backward constant amplitude wave. Usually,the imaginary part of the growing wave is defined as linear growth rate. And the corresponding linear gain is described as follows:
.
The changing trends of unity gain in the whole bandwidth,under the different lossy situations,are shown in Fig. 6. When the conductivity decreases,the loss increases,and the gain per unit length also decreases significantly. In addition,the operating bandwidth is extended to both high and low frequencies. As conductance is ,the max value of linear gain is about . When the interaction circuit is 64 mm,the total gain is bigger than ,which also can be seen in Fig. 9.
Figure 6.The linear gain versus frequency with losses and different conductance lossy circuit(,,,)
Figure 8.At 220 GHz,, , , , (a) the effect of the number of periods on the output power and gain, when , (b) the effect of the dielectric slot ratio on the output power and gain when the number of periods is 21
In real operation situation,the high-frequency field cannot sustain the exponential growth as predicted in linear theory. Rather,it decreases after reaching a maximum value,this phenomenon is known as saturation. It is mainly caused by the over-bouncing of electron beam,also the nonlinear characteristic of the beam-wave interaction. Therefore,in order to study the interaction more deeply and accurately which includes the nonlinear changing trend of field amplitude and the variation of beam power,wave power,and lost power,nonlinear theory is necessary. The nonlinear used in this paper is electron kinetic theory [3-4],which is combined with six electron kinetic equations and a high frequency field equation.
Using nonlinear theory to calculate the axial field amplitude variation. And,the axial field amplitude can be divided into forward wave and backward wave. The normalized field profiles of three mainly backward wave oscillation modes are shown in Fig. 7. Start length of ,, are calculated as 10.1 mm,16.1 mm and 14.41 mm,respectively. Not only the start lengths,but the oscillation frequencies also are basically consistent with the linear theoretical calculation results. For restricting of backward wave oscillations,the nonlinear stage length is set as 9.5 mm.
First,due to the length of the superconducting magnets uniform part in our laboratory is 65 mm. Therefore,the length of the overall interaction structure is set at about 65 mm. Secondly,in order to ensure that the input coupler has enough space for modulation and that the length of the smooth output section is less than the oscillation start length,the lengths of the smooth input end and the smooth output section are set to 4.5 mm and 9.5mm respectively. So,the initial length of the PDL section was set around 51 mm. Furthermore,as a single-mode theory,the influence of the competing mode is ignored,so the analysis of the PDL section structure mainly focuses on the number of periods and the dielectric slot ratio(, is media width, is the cycle width). As shown in the Fig. 8(a),the effect of the number of periods on the output power and gain,when . It can be seen,when the dielectric slot ratio is fixed,as the number of periods is 21,the output power reaches the maximum of 69.88 kW and the gain is 53.67 dB. When the number of periods decreases,the width of the dielectric in a single period increase,the working mode has more energy entering the dielectric area,which increases the loss of the signal and affects the modulation of the electrons. The clustering state is not enough to release a large amount of energy,resulting in a decrease in output power. When the number of periods increases,although the dielectric width becomes smaller,and the loss to the signal decreases,but it will cause the over-clustering of electrons,which will cause the interaction to enter the supersaturation state in advance,and the output power decreases. Figure 8(b)shows the effect of the dielectric slot ratio on the output power and gain when the number of periods is 21. When the dielectric slot ratio is smaller,the dielectric width will be larger. Otherwise,the dielectric width will be smaller,and the loss of the working mode will change,which will affect the modulation state of the electrons,thereby affecting the output performance. In order to ensure the optimal performance of the Gyro-TWT,the total length of the dielectric rings loading section is finally set to 50.4 mm,of which the number of periods is 21,the period width is 2.4mm,and the dielectric width is 2 mm. The overall lenght of interaction structure is 64.4 mm.
The linear gain and nonlinear gain versus circuit length are shown in Fig. 9. We can see,at 220 GHz,the profiles of two gains in the linear stage keep pretty high consistency. The difference between the two gains is named launching loss and is caused by,in the input power,only the growing wave part contributes to the gain,and the decaying wave produces a negative gain in the beginning()and a part of input signal energy is used on the bouncing of electrons. In the nonlinear stage,as losses waveguide,the nonlinear gain increases significantly,and gradually approaches saturation.
Besides,the variation of beam power ,wave power and loss power are calculated using nonlinear theory. Figure 10 shows the nonlinear theory analysis results of , and at 220 GHz,when ,,,, and ,the results satisfy the law of conservation of energy. The sum of lost power and wave power equals the loss of beam power. The is amplified along the propagation direction and saturated at . Where the output power is 69.88 kW,the efficiency is 33.28% and the gain is 53.67 dB.
Figure 10., and versus interaction circuit length(,,,, and ,at 220 GHz)
As a single-mode theory,the nonlinear theory cannot calculate the multi modes of competition and also neglected the space charge influence. So,Using the electromagnetic simulation software,to do the PIC simulation would get the more accurate results.
2 PIC simulation
For further research of parasitic oscillations in this gyro-TWT,the backward wave oscillation of , also are observed and analyzed in 3D-PIC simulation(CST). Besides,the final optimized model has been proved zero drive stability and simulated in 3D-PIC simulation software. The detailed results of the PIC simulation are presented in the below sections.
2.1 Oscillation analyses in the PIC simulation
The backward wave oscillation phenomenon results are shown in Fig. 11,when . Fig. 11(a)is the evolution of the peak power’s()quadratic root value of four modes,,,,. Meantime,the average power is half of . We can see that,at about 1ns to 4ns,the power of is stable out in the ouput port. And after 4 ns,the power of grows gradually,then the operational mode’s power lost the dominated position,the backward wave oscillation is established. Figure 11(b),the frequency spectrum,clearly shows that the frequency of backward wave oscillation mode is 164.45 GHz which is basically consistent with the theoretical study,although the working status is suppressed,the frequency spectrum of also can clearly see the operational frequency 220 GHz.
.
Figure 11.The backward wave oscillation phenomenon (with as input signal at 220 GHz, , , , , ) (a) evolution of the quadratic root value of in the output part versus time (b) frequency spectrum of the output signals
It needs to be mentioned here,as we have determined the dielectric conductance as ,in the CST simulation,the conductance has been transformed into a complex relative dielectric constant by the Eq. 5.
As the nonlinear stage length is already smaller than the start length of . So,the attenuation of dielectric with versus the dielectric thickness has been studied and is shown in Fig. 12. When dielectric thickness equals 0.3 mm,the attenuation of is pretty smaller. For successfully suppressing the backward wave oscillation,the thickness is set to 0.43mm where the attenuation of is maximum in around,and the attenuation of is as small as possible which will keep enough gain for the amplify.
Figure 12.Attenuation of dielectric versus the dielectric thickness with
In addition,the backward wave oscillation also has been observed,when ,,the results are shown in Fig. 13. At about 8.5 ns, gradually occupied the dominant position and output signal is affected and decreases significantly. The frequency spectrum also shows that the oscillation frequency of is 185.59 GHz. And in the optimized process,when smaller than ,this oscillation is disappeared. Thus,the oscillation of also proved the correctness of theoretical studies. In the process of the optimized simulation, backward wave oscillation and absolute instability oscillation are not caught.
Figure 13.The backward wave oscillation phenomenon (with as input signal at 220 GHz, , , , ) (a) evolution of the quadratic root value of in the output part versus time, (b) frequency spectrum of the output signals
Figure 14 demonstrates the evolution of four competition modes signal at the output port in zero drive situation. The output signals of modes show the significant characters including ignorable growth and a relative low level,which means that all parasitic oscillations have been suppressed completely.
Figure 14.Output port signal of the four mainly competitional modes versus the simulation time at zero drive
Figure 15(a)is the output signal of the operating mode in the output port. And Fig. 15(b)is the frequency spectrums of and three main competition modes. After the post processing of CST,the simulation predicted average power of about 55.61 kW at 220 GHz. From Fig. 15(b),we also can see that,the competition modes are suppressed pretty well,no clear oscillation frequency occurred,and only the second harmonic frequency 440.01 GHz is caught in the spectrum which is no impact on the stable operation.
Figure 15.The 3D-PIC simulation results of optimized model (, at 220 GHz) (a) evolution of the quadratic root value of in the output port versus time, (b) frequency spectrum of the output signals
In this part,the nonlinear theory simulation results,3D-PIC simulation results are compared. Figure 16 is the comparison of output power versus frequency between nonlinear numerical program and 3D-PIC simulation. It’s clearly that the 3D-PIC simulation output power reaches 55.61 kW at 220 GHz. Meantime the output power under two simulation ways basically keeps the same trend and is greater than 45 kW between 219 GHz and 226 GHz. The -3 dB bandwidth is 217.5 GHz to 229.5 GHz,about 12 GHz. The comparison of output power gain versus different input power also is analyzed and shown in Fig. 17. In this figure,the overall trend of gain curves basically agrees with each other. In the area where the input power is smaller than 0.1 W,the gain is almost saturated and the saturated gain of CST simulation is 53.56 dB. When input power equals 0.55 W,the gain is about 49.46 dB. As the input power increases,when it is greater than 1 W,the gain decreases rapidly.
Figure 16.Comparison of output power versus frequency with at 220 GHz
The fundamental harmonic 220 GHz PDL gyro-TWT operating at has been designed,by theoretical absolute instability oscillation and backward wave oscillations are predicted by theoretical studies,verified by the CST 3D-PIC simulation,and suppressed successfully. The CST 3D-PIC simulation results show that the saturated output power reaches 55.61 kW at 220 GHz with gain of 49.46 dB,and the efficiency is 26.48% with the beam voltage of 70 kV,beam current of 3 A,and the velocity pitch factor of 1.2. The saturated gain is 53.56 dB,and the -3 dB bandwidth is 12 GHz. The performance of gyro-TWT is compared by the nonlinear numerical program,CST 3D-PIC simulation,whose results are basically consistent.
References
[1] M Thumm. State-of-the-art of high-power gyro-devices and free electron masers. Journal of Infrared, Millimeter, and Terahertz Waves, 41, 1-140(2020).
[2] K R Chu. Overview of research on the gyrotron traveling-wave amplifier. IEEE Transactions on Plasma Science, 30, 903-908(2002).
[3] C H Du, P K Liu. Millimeter-wave gyrotron traveling-wave tube amplifiers(2014).
[4] K R Chu, H Y Chen, C L Hung et al. Theory and experiment of ultrahigh-gain gyrotron traveling wave amplifier. IEEE Transactions on Plasma Science, 27, 391-404(1999).
[5] R Yan, Y Tang, Y Luo. Design and experimental study of a high-gain W-band gyro-TWT with nonuniform periodic dielectric loaded waveguide. IEEE Transactions on Electron Devices, 61, 2564-2569(2014).
[6] J R Sirigiri, M A Shapiro, R J Temkin. High-power 140-GHz quasioptical gyrotron traveling-wave amplifier. Physical review letters, 90, 258302(2003).
[7] E A Nanni, S Jawla, S M Lewis et al. Photonic-band-gap gyrotron amplifier with picosecond pulses. Applied Physics Letters, 111, 233504(2017).
[8] D Liu, X Tang, Y Yan et al. Design of confocal waveguide interaction structure for a 220 GHz gyro-TWT. Journal of ElEctromagnEtic WavEs and applications, 31, 650-662(2017).
[9] C An, D Zhang, J Zhang et al. Theoretical analysis and PIC simulation of a 220-GHz second-harmonic confocal waveguide gyro-TWT amplifier. IEEE Transactions on Electron Devices, 66, 4016-4021(2019).
[10] E Wang, X Zeng, B Liu et al. Experimental study of high-power gyrotron traveling-wave tube with periodic lossy material loading. IEEE Transactions on Plasma Science, 40, 1846-1853(2012).
[11] C H Du, T H Chang, P K Liu et al. Design of a W-band gyro-TWT amplifier with a lossy ceramic-loaded circuit. IEEE transactions on electron devices, 60, 2388-2394(2013).
[12] M Thottappan. Design and efficiency enhancement studies of periodically dielectric loaded W-band gyro-TWT amplifier. IEEE Transactions on Electron Devices, 67, 2925-2932(2020).
Ru-Tai CHEN, Sheng YU. Theoretical study and PIC simulation of a 220 GHz Gyro-TWT with periodic dielectric loaded waveguide[J]. Journal of Infrared and Millimeter Waves, 2022, 41(6): 1042