• Laser & Optoelectronics Progress
  • Vol. 56, Issue 21, 213001 (2019)
Leilei Zhang1、2, Jiaxiang Liu2, Zhizhen Zhu2, Yonghua Fang1、2、*, Yue Wu2, Wenkang Yang2, Mengqi Tao2, and Zhiqiang Ning1、2
Author Affiliations
  • 1School of Environmental Science and Optoelectronic Technology, University of Science and Technology of China, Hefei, Anhui 230026, China
  • 2Anhui Institute of Optics and Fine Mechanics, Chinese Academy of Sciences, Hefei, Anhui 230031, China
  • show less
    DOI: 10.3788/LOP56.213001 Cite this Article Set citation alerts
    Leilei Zhang, Jiaxiang Liu, Zhizhen Zhu, Yonghua Fang, Yue Wu, Wenkang Yang, Mengqi Tao, Zhiqiang Ning. Detection of Trace Sulfur Dioxide Gas Using Quartz-Enhanced Photoacoustic Spectroscopy[J]. Laser & Optoelectronics Progress, 2019, 56(21): 213001 Copy Citation Text show less
    Coefficients of 1st-4th order harmonic components of Lorentz absorption line
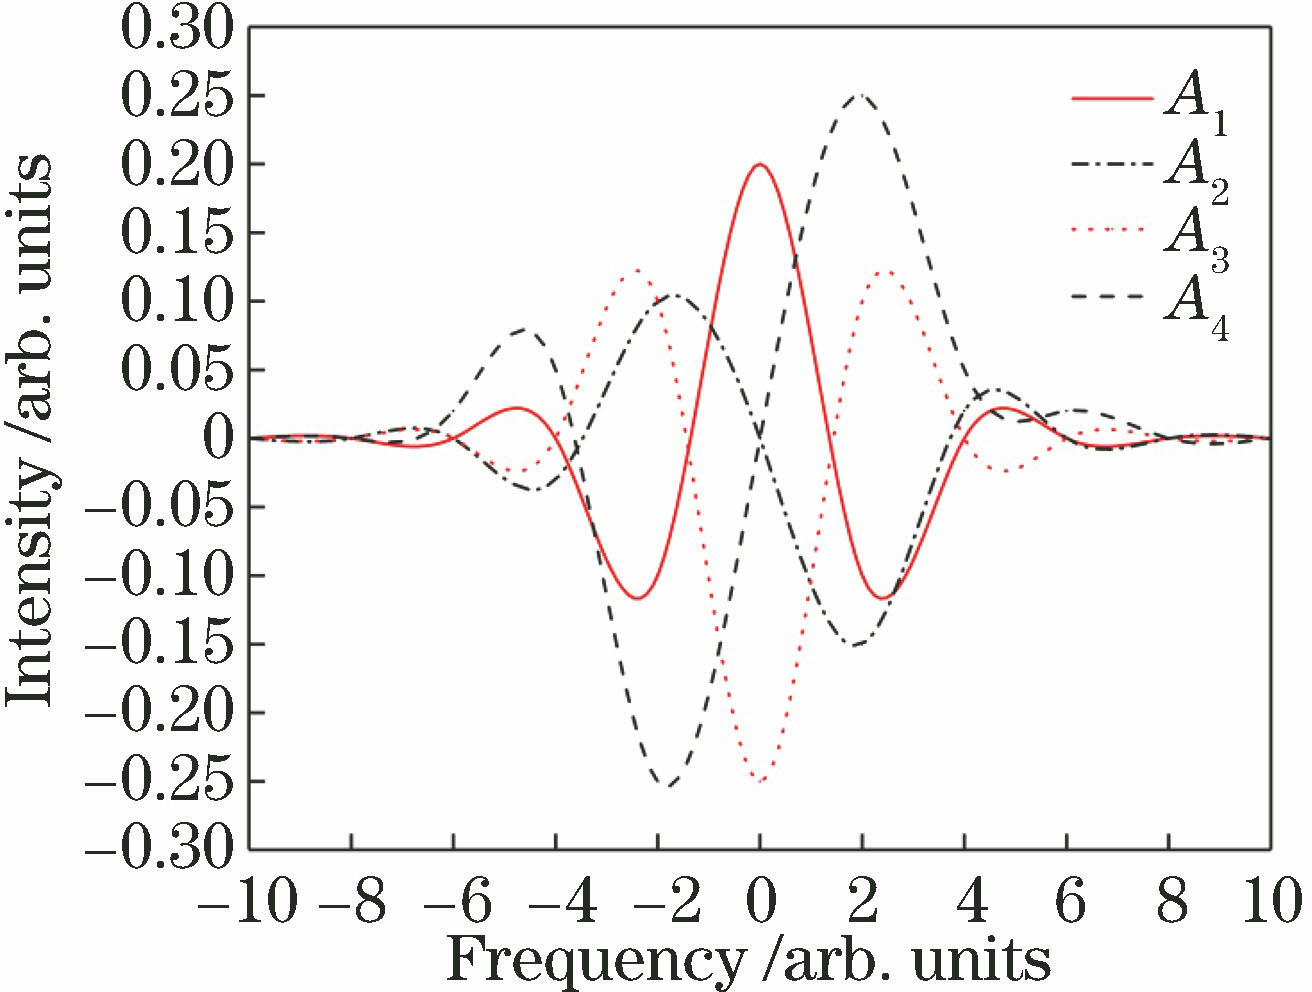
    Fig. 1. Coefficients of 1st-4th order harmonic components of Lorentz absorption line
    Physical diagram of quartz tuning fork
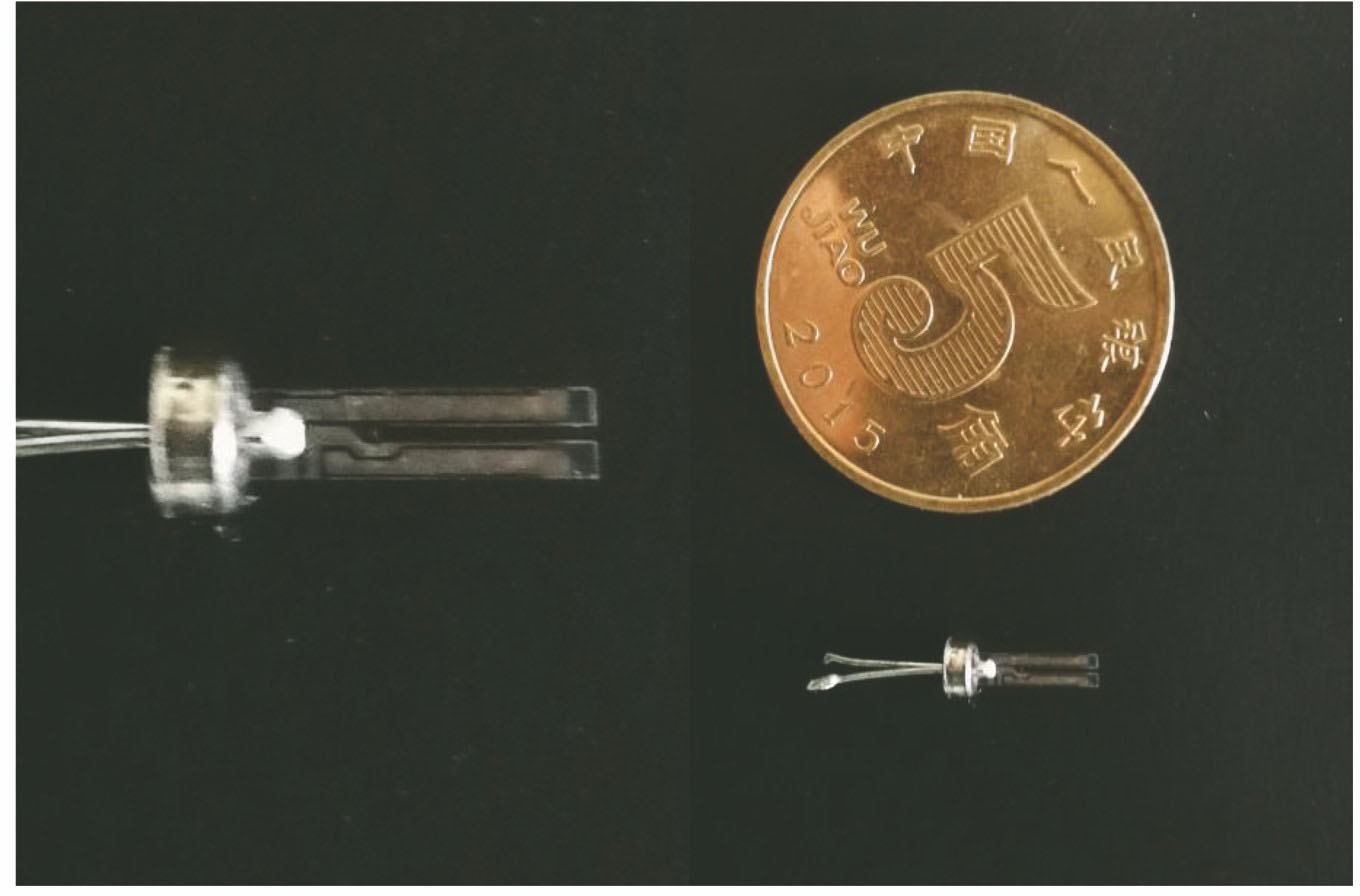
    Fig. 2. Physical diagram of quartz tuning fork
    Three-dimensional model of quartz tuning fork.(a) Size parameters of quartz tuning fork; (b) three-dimensional modeling of quartz tuning fork
    Fig. 3. Three-dimensional model of quartz tuning fork.(a) Size parameters of quartz tuning fork; (b) three-dimensional modeling of quartz tuning fork
    Vibration shapes of first six order models of the quartz tuning fork. (a) 1st order; (b) 2nd order; (c) 3rd order; (d) 4th order; (e) 5th order; (f) 6th order
    Fig. 4. Vibration shapes of first six order models of the quartz tuning fork. (a) 1st order; (b) 2nd order; (c) 3rd order; (d) 4th order; (e) 5th order; (f) 6th order
    Comparison of absorption line intensities of hydrogen sulfide, water, and carbon dioxide
    Fig. 5. Comparison of absorption line intensities of hydrogen sulfide, water, and carbon dioxide
    Simulated absorption spectrum of hydrogen sulfide gas with volume fraction of 20×10-6
    Fig. 6. Simulated absorption spectrum of hydrogen sulfide gas with volume fraction of 20×10-6
    Schematic of resonant frequency scanning for quartz tuning fork
    Fig. 7. Schematic of resonant frequency scanning for quartz tuning fork
    Structural diagram of hydrogen sulfide gas measurement system based on QEPAS
    Fig. 8. Structural diagram of hydrogen sulfide gas measurement system based on QEPAS
    Photoacoustic signals under different concentrations of hydrogen sulfide gas
    Fig. 9. Photoacoustic signals under different concentrations of hydrogen sulfide gas
    Second harmonic signal of hydrogen sulfide with volume fraction of 100×10-6
    Fig. 10. Second harmonic signal of hydrogen sulfide with volume fraction of 100×10-6
    ParameterDLTw2s
    Value/mm5.023.420.540.230.20
    Table 1. Size parameters of quartz tuning fork
    Modal orderModal frequency of SolidWorksModal frequency of COMSOLMode shapeStandard value
    18755.78755.9One-way swing-
    21396513942Staggered swing-
    33004230022One-way swing-
    43275632854Symmetrical vibration32768
    55190451936Bending and twisting-
    67742877522Stagger twist-
    Table 2. Simulated results of the first six modes of quartz tuning forkHz
    Leilei Zhang, Jiaxiang Liu, Zhizhen Zhu, Yonghua Fang, Yue Wu, Wenkang Yang, Mengqi Tao, Zhiqiang Ning. Detection of Trace Sulfur Dioxide Gas Using Quartz-Enhanced Photoacoustic Spectroscopy[J]. Laser & Optoelectronics Progress, 2019, 56(21): 213001
    Download Citation