• Chinese Optics Letters
  • Vol. 15, Issue 9, 090002 (2017)
O. Semyachkina-Glushkovskaya1, A. Abdurashitov1, A. Pavlov1、2、*, A. Shirokov3, N. Navolokin4, O. Pavlova1, A. Gekalyuk1, M. Ulanova1, N. Shushunova1, A. Bodrova1, E. Saranceva1, A. Khorovodov1, I. Agranovich1, V. Fedorova1, M. Sagatova1, A. E. Shareef1, C. Zhang5、6, D. Zhu5、6, and V. Tuchin1、7、8
Author Affiliations
  • 1Saratov National Research State University, Saratov 410012, Russia
  • 2Yuri Gagarin State Technical University of Saratov, Saratov 410054, Russia
  • 3Institute of Biochemistry and Physiology of Plants and Microorganisms, Russian Academy of Sciences, Saratov 410049, Russia
  • 4Saratov State Medical University, Saratov 410012, Russia
  • 5Britton Chance Center for Biomedical Photonics, Wuhan National Laboratory for Optoelectronics (WNLO), Huazhong University of Science and Technology (HUST), Wuhan 430074, China
  • 6Key Laboratory for Biomedical Photonics, HUST, Ministry of Education, Wuhan 430074, China
  • 7National Research Tomsk State University, Tomsk 634050, Russia
  • 8Institute of Precision Mechanics and Control, Russian Academy of Sciences, Saratov 410028, Russia
  • show less
    DOI: 10.3788/COL201715.090002 Cite this Article Set citation alerts
    O. Semyachkina-Glushkovskaya, A. Abdurashitov, A. Pavlov, A. Shirokov, N. Navolokin, O. Pavlova, A. Gekalyuk, M. Ulanova, N. Shushunova, A. Bodrova, E. Saranceva, A. Khorovodov, I. Agranovich, V. Fedorova, M. Sagatova, A. E. Shareef, C. Zhang, D. Zhu, V. Tuchin. Laser speckle imaging and wavelet analysis of cerebral blood flow associated with the opening of the blood–brain barrier by sound[J]. Chinese Optics Letters, 2017, 15(9): 090002 Copy Citation Text show less

    Abstract

    The cerebral blood flow (CBF) alterations related to sound-induced opening of the blood–brain barrier (BBB) in adult mice are studied using laser speckle contrast imaging (LSCI) and wavelet analysis of vascular physiology. The results clearly show that the opening of the BBB is accompanied by the changes of venous but not microvessel circulation in the brain. The elevation of the BBB permeability is associated with the decrease of venous CBF and the increase of its complexity. These data suggest that the cerebral veins rather than microvessels are sensitive components of the CBF related to the opening BBB.

    The blood–brain barrier (BBB) is a highly selective gatekeeper, which controls the passage of blood-borne agents into the brain tissues protecting the brain against pathogens. In the early 1940s in experiments ex vivo using basic vital dyes, which do cross the BBB, it has been established that the anatomic site of the BBB is the brain microvasculature. This historic fact is clearly reviewed by Broman[1] and Friedemann[2], as well as in modern publications[3].

    Solute clearance across the BBB is an important function of cerebral blood flow (CBF). The rate of blood flow within the brain parenchyma, where the BBB is located, is 130-fold greater than the rate of blood flow within the choroid plexus, where the leaky choroid barrier is resented[4]. Thus, a high rate of the CBF is associated with the strong control of the BBB function.

    The cerebral circulation keeps a stable and unique extracellular environment within the neurovascular unit, which is essential for the BBB function. Clinical and experimental data suggest that regulation of the BBB is often impaired in pathological brain conditions associated with diverse vascular abnormalities, such as ischemia, stroke, brain tumors, or trauma leading directly to the malfunction of the neurovascular unit and long-lasting changes in neuronal activity[59].

    Despite accumulating evidence for the crucial role of CBF in the BBB function, there is limited information about the changes of CBF related to the BBB disruption. Here, we studied changes of CBF in mice associated with the opening BBB by sound, using a proposed algorithm for laser speckle contrast imaging (LSCI) and wavelet analysis of the venous and microvascular components of the CBF.

    Experiments were carried out in adult male mice that were two months old, using four groups: (1) no sound, the control group, (2) 90 min, (3) 4 h, and (4) 24 h after sound-stress. Each group included 10 mice. All procedures were performed in accordance with the “Guide for the Care and Use of Laboratory Animals”[10].

    To induce the opening of BBB, we used audible sound (110 dB, 370 Hz): 60 s sound, then 60 s pause, and this cycle repeated during 2 h. This procedure was performed using a sound transducer in a Plexiglas® chamber (the volume 2000cm3), amplifying the effect of sound on mice and not passing sound out.

    A polyethylene catheter (PE-10 tip, Scientific Commodities INC., Lake Havasu City, Arizona) was inserted into the right femoral vein for Evan’s Blue (EB) dye (Sigma Chemical Co., St. Louis, MI, USA) intravenous injection in a single bolus dose (2 mg/25 g mouse, 1% solution in physiological 0.9% saline). The EB circulated in the blood for 30 min. The implantation of the catheter was performed under the inhalation anesthesia (2% isoflurane, 70% N2O, and 30% O2). At the end of the circulation time, the mice were killed by decapitation, and their brains were quickly collected and analyzed using fluorescence spectroscopy (620/680 nm). The standard calibration curve was used for the measurement of EB concentration (μg per g of tissues or blood).

    Fluorescein rhodamine (FITC)-dextran 70 kDa was used as the additional method for characterization of the BBB permeability to high-weight molecules. FITC-dextran was injected intravenously (4 mg/25 g mouse, 0.5% solution in 0.9% physiological saline, Sigma) and circulated 2 min. Afterwards, the mice were killed by decapitation, and the brains were quickly removed, fixed in 4% paraformaldehyde (PFA) for 24 h, cut into 50 μm thick slices on a vibratome (Leica VT 1000S Microsystem, Germany), and analyzed on a confocal microscope (Nikon TE 2000 Eclipse, Tokyo, Japan).

    All mice were decapitated after the performed experiments. The samples of the brain were fixed in 10% buffered neutral formalin. The formalin fixed specimens were embedded in paraffin, sectioned (4 μm), and stained with haematoxylin and eosin. The histological sections were evaluated by light microscopy (mVizo-103, Russia).

    A home-made system for the LSCI was used for measurements of the perfusion of brain tissues. The raw speckle images were recorded under the following conditions: light source—HeNe laser with the wavelength 632.8 nm; image sensor—CMOS camera Basler acA2500-14 gm; imaging lens—Computer M16140-MP2 16 mm at F-number equal to six that corresponds to speckle/pixel size ratio of around two; exposure time
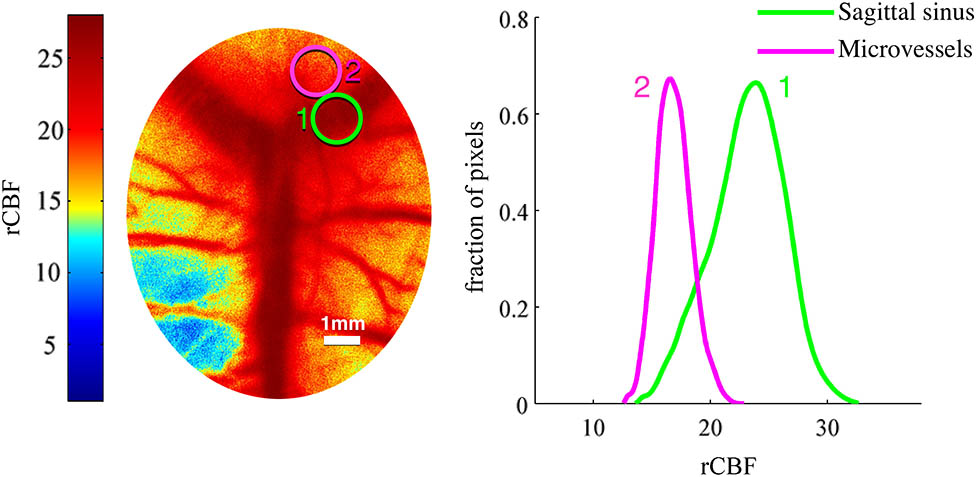
 20ms. The speckle images were recorded for 3 min at an average frame rate of 40 frames per second. Spatial speckle contrast was calculated as K=σ/I, where σ is the standard deviation of intensity fluctuations, and I, is the mean intensity within a 5×5 sliding window. The 50 consecutive frames were averaged into one speckle contrast image. Information about macro- (the sagittal sinus) and microcirculation (capillaries, arterioles, and venules) was extracted simultaneously. For this purpose, two clearly separated regions of interest (ROIs) are overlaid onto the LSCI image, related to: (1) the sagittal sinus, which is one of four major sinuses collecting blood from the small veins of the brain and (2) small, optically unresolvable vessels (Fig. 1). The temporal dynamics of blood flow in macroscopic and microscopic vessels were analyzed by tracking the position of the most probable contrast value in the particular ROI. For a reference point in the sagittal sinus of the control group, we choose a contrast value, which is inversely proportional to relative CBF (rCBF) up to a constant. As the value of this constant is still under discussion[11,12], we set it to unity and the contrast values for other groups were recalculated as a fraction of this reference value.

    (Color online) (A) Two ROIs are overlaid onto LSCI image and (B) normalized histograms of these ROIs.

    Figure 1.(Color online) (A) Two ROIs are overlaid onto LSCI image and (B) normalized histograms of these ROIs.

    To characterize changes of the CBF, we used the wavelet-based multifractal analysis[13]. This approach assumes the estimation of the continuous wavelet-transform with the extraction of skeleton lines, i.e., the lines of local minima and maxima of wavelet-transform coefficients. For a signal x(t), the continuous wavelet-transform is estimated as W(a,z)=1ax(t)ψ(tza)dt,where a and z are the scale and the translation of the basic function ψ(t)=(1t2)exp(t22).

    All skeleton lines are extracted by a selection of local maxima and minima of the wavelet-transform coefficients W(a,z) at fixed values of the scale parameter a. Further, the partition functions are constructed Z(q,a)=lL(a)(supaa|W(a,zl(a))|)qaτ(q),where L denotes a full set of skeleton lines existing at the scale a, and zl defines the position of the current line with the number l. Scaling exponents τ(q) can easily be found as slopes of the dependencies logZ(q,a) versus log a for each value of q. The singularity spectrum is estimated via the Legendre transform[14]D(h)=qhτ(q),h(q)=dτ(q)dq.

    The position of the singularity spectrum D(h) associated with the mean Hölder exponent H=h(0) characterizes correlations of the analyzed experimental data. Unlike the standard correlation function, the used approach provides a way of significant reduction of the amount of data required for authentic identification of the analyzed regime[15]. Besides, it can be applied for highly nonstationary time series, which is why it is often used in physiological studies[16].

    The results were reported as mean±standard error of the mean (SEM). Differences from the initial level in the same group were evaluated by the Wilcoxon test. Intergroup differences were evaluated using the Mann–Whitney test and ANOVA-2 (post hoc analysis with the Duncan’s rank test). Significance levels were set at p<0.05 for all analyses.

    We studied the effect of sound on the BBB permeability using classical methods: spectrofluorometric and confocal assay of extravasation of high-weight molecules, such as EB 68.5 kDa (bound to serum albumin) and dextran 70 kDa, respectively. Both of these tracers do not permeate the intact BBB, and, therefore, they are widely used for the evaluation of the BBB disruption[17,18]. A histological analysis of BBB permeability to water was performed for the study of BBB permeability to solute of small molecular weight.

    The EB concentration in the brain of intact mice (without sound) was about zero (0.39±0.01μg/g of tissue). The sound caused the significant leakage of BBB for EB (Fig. 2). In 90 min after sound, the content of EB in the brain increased 23.3-fold versus the control group (9.10±0.33 versus 0.39±0.01, μg/g of tissue, p<0.05). The sound-induced BBB disruption was reversible, and already in 4 h after sound, the BBB function completely recovered (EB=0.41±0.02μg/g of tissue). The next day after sound exposure, the EB leakage increased again, but these changes were not statistically significant (EB=0.54±0.03, μg/g of tissue).

    Spectrofluorometric assay of EB extravasation from the blood into the brain parenchyma suggesting the increase in the BBB permeability to EB in 90 min after sound with afterward-rapid normalization of BBB leakage in 4 h. Asterisks indicate significant changes (p<0.05).

    Figure 2.Spectrofluorometric assay of EB extravasation from the blood into the brain parenchyma suggesting the increase in the BBB permeability to EB in 90 min after sound with afterward-rapid normalization of BBB leakage in 4 h. Asterisks indicate significant changes (p<0.05).

    For dextran 70 kDa, it was clearly shown that in the normal state (before sound), the BBB was not permeable for this tracer [Fig. 3(A)].

    (Color online) Confocal imaging of BBB permeability to dextran 70 kDa in mice before and after sound: (A) no extravasation of dextran 70 kDa before sound; (B) and (C) extravasation of dextran 70 kDa in 90 min and 24 h after sound, respectively [defined as red clouds around the sagittal sinus, which is a main cerebral vein (B)], and a group of microvessels, including venules, draining the blood into the cerebral vein (C).

    Figure 3.(Color online) Confocal imaging of BBB permeability to dextran 70 kDa in mice before and after sound: (A) no extravasation of dextran 70 kDa before sound; (B) and (C) extravasation of dextran 70 kDa in 90 min and 24 h after sound, respectively [defined as red clouds around the sagittal sinus, which is a main cerebral vein (B)], and a group of microvessels, including venules, draining the blood into the cerebral vein (C).

    It is important to note that during all of the time of observation when the BBB is opened (90 min and 24 h after sound), we discovered the high permeability of cerebral vessels to dextran in both venous and microvascular types of vasculature. Figure 3(B) shows the leakage of dextran in the sagittal sinus, which is the main cerebral vein collecting the blood from the brain and drains it to the peripheral circulation. Figure 3(C) shows the leakage of both types of cerebral vessels: veins and microvessels. The high permeability to dextran of small vessels (venules) draining the blood into the big vein is clearly seen.

    Figure 4 shows the histological analysis of the BBB permeability to solutes of small molecular weight, including water, before and after sound. The vasogenic edema, i.e., fluid pathway from the vessels, was observed in 90 min after sound, suggesting the high BBB permeability to water and other small molecular weight solutes with their accumulation in the space between cerebral vessels and brain parenchyma. These morphological changes kept during the 24 h after sound-stress and recovered only in the next two days after sound exposure.

    Histological analysis of BBB permeability to solutes of small molecular weight: (A) before sound, no solute extravasation; (B) in 90 min after sound, the vasogenic edema observed suggests the high BBB leakage for the water and other solutes with their accumulation in space between cerebral microvessels and the brain parenchyma; (C) in 24 h after sound-stress, the vasogenic edema is still observed.

    Figure 4.Histological analysis of BBB permeability to solutes of small molecular weight: (A) before sound, no solute extravasation; (B) in 90 min after sound, the vasogenic edema observed suggests the high BBB leakage for the water and other solutes with their accumulation in space between cerebral microvessels and the brain parenchyma; (C) in 24 h after sound-stress, the vasogenic edema is still observed.

    The statement that the anatomic site of the BBB is cerebral microvessels is based predominantly on the data of electronic microscopy and immunohistochemistry obtained in 40 years of the last century, i.e., in ex vivo studies[1,2]. Nowadays, due to progress in optical methods for in vivo analysis of vascular nature, the new approaches for the in vivo study of the BBB physiology are available. The LSCI is one of the novel optical modalities that can be effectively used to study the changes of CBF related to the BBB opening in veins and microvasculature of the brain.

    Figure 5 shows the correlation between the time of opening of the BBB and the changes in the CBF. The results clearly demonstrate that the sound-induced increase in the BBB permeability to high (EB/dextran) and low (solutes) molecular weight substances in 90 min elapsed after sound application is associated with a significant decrease in venous blood circulation. The recovery of the BBB function in 4 h of elapsed time after sound-stress was accompanied by a recovery of the venous CBF. However, the prolonged accumulation of water in the brain parenchyma due to the long-time recovery from vasogenic edema was accompanied by the repeated BBB opening in 24 h after stress, probably via the increase in intracranial pressure. These changes in the BBB leakage are again associated with suppression of the venous CBF.

    (Color online) LSCI for monitoring of the CBF of the cerebral veins and microvessels in four groups: control–(without sound); 90 min after sound—the reduction of venous CBF associated with the opening BBB; 4 h after sound—normalization of the venous CBF with recovery of the BBB; 24 h after sound—the repeated decrease in the venous CBF associated again with the opening BBB. No significant changes in the CBF on the level of microcirculation in different times after sound.

    Figure 5.(Color online) LSCI for monitoring of the CBF of the cerebral veins and microvessels in four groups: control–(without sound); 90 min after sound—the reduction of venous CBF associated with the opening BBB; 4 h after sound—normalization of the venous CBF with recovery of the BBB; 24 h after sound—the repeated decrease in the venous CBF associated again with the opening BBB. No significant changes in the CBF on the level of microcirculation in different times after sound.

    There were no pronounced and statistically significant changes in the CBF on the level of microvessels, probably due to compensatory mechanisms via distribution of blood in the cerebral veins as capacity link of the CBF.

    In the previous work, the effectiveness of the wavelet analysis of CBF to discriminate the sensitivity of different vasculature components to stress during the development of vascular catastrophes in the brain was demonstrated[19,20]. In particular, a higher sensitivity of cerebral veins to stress compared with microvessels was shown. In this study, we also performed a wavelet-based analysis of CBF in the cerebral veins and microvessels.

    The results of this series of experiments showed similar data to the LSCI: the BBB opening in 90 min and 24 h after sound-stress was associated with stronger changes of the mean Hölder exponent H quantifying CBF data in the cerebral veins compared to much weaker changes in the microvessels (Fig. 6). The value of H is increased by 51% (1.57±0.15 for 90 min, cerebral veins), as compared with the control (1.04±0.08), and only by 13% for microvessels (1.11±0.08 for 90 min versus 0.98±0.05 for the control).

    (Color online) Wavelet-based analysis of the changes of the CBF in the cerebral veins (orange) and microvessels (violet) before and after sound: the control (without sound); in 90 min and 24 h elapsed after sound-stress, the disruption of BBB function is seen; in 4 h, the recovery of the BBB function is seen. Asterisk indicates significant changes (p<0.05).

    Figure 6.(Color online) Wavelet-based analysis of the changes of the CBF in the cerebral veins (orange) and microvessels (violet) before and after sound: the control (without sound); in 90 min and 24 h elapsed after sound-stress, the disruption of BBB function is seen; in 4 h, the recovery of the BBB function is seen. Asterisk indicates significant changes (p<0.05).

    For CBF measurements performed in 4 and 24 h, the observed changes are less essential at both the macroscopic level of cerebral veins (0.99±0.14 for 4 h; 1.17±0.14 for 24 h) and the microvessels (0.94±0.07 for 4 h; 1.02±0.13 for 24 h).

    The revealed changes in the mean Hölder exponent have a relation with the corresponding changes in the decay of the correlation function and the power-law behavior of the spectral density. The latter characteristics, however, are difficult to estimate directly based on short and nonstationary data series acquired in physiological experiments. Due to this, the application of the wavelet-based multifractal formalism provides an indirect way of quantifying spectral and correlation properties of CBF, using a quite small amount of data.

    The application of LSCI as a potential useful tool for the analysis of the BBB function is discussed in the review of Pandey et al.[21]. Using LSCI and wavelet analysis of CBF, here, we clearly show that the BBB opening by a sound-stress is associated with changes in the venous but not microvessel component of CBF. Indeed, the BBB opening is associated with the CBF changes in the character of blood distribution in the cerebral venous circulation as a capacitive link of the CBF, probably due to a compensatory mechanism. We assume that the changes in cerebral veins sensitively reflect the different scenarios of opening BBB by sound: in 90 min after sound exposure, the BBB opens for both high and low molecular weightsubstances, this is immediately associated with the suppression of cerebral venous circulation by 33% (p<0.05);in 4 h after sound exposure, due to the activation of recovery processes, the BBB permeability normalizes with the similar changes in the venous CBF;in 24 h after sound exposure, the prolonged accumulation of water in the brain parenchyma due to the long-lasting processes of recovery from vasogenic edema, probably, provokes an increase in the intracranial pressure, which induces, once again, a BBB opening; however, it is rather weak with a significant decrease in the venous CBF by 35% (p<0.05).

    It should be noted that confocal imaging of the BBB disruption shows the high permeability of microvessels, including large (the sagittal sinus) and small cerebral veins [Figs. 3(B) and 3(C)]. In summary, the data received demonstrate that the cerebral veins are more sensitive to the BBB dysfunction versus microvasculature of the brain. We suggest that the distribution of blood in the cerebral venous system might be one of the important mechanisms that is responsible for keeping the microvessles, as a functional platform for the BBB, from overloading of blood and creating an optimal environment for the effective work of recovery processes during the BBB opening.

    However, now it is difficult to make a comparison with the other works because there is no reliable data for the CBF behavior associated with the BBB disruption due to the lack of research in this area. One group of authors, by using laser Doppler flowmetry, showed different changes in the CBF associated with the different sources for the transient BBB opening: the bile salt deoxycholic acid-induced BBB injuries are accompanied by an increase in the arterial and venous components of the CBF, while trombotic-induced BBB disruption is associated with an increase in the arterial but a decrease in venous cerebral circulation[22]. Some authors observed the pattern of reduced rCBF in the region of the opening of the BBB during hypoxic-ischemia in mice[23,24]. Others using autoradiographic measurements and ischemic injuries of BBB indicate that the CBF is not an influencing factor for the assessments of BBB permeability[25].

    The data presented and discussed clearly show that more detailed studies of CBF related to the BBB disruption may shed light on a better understanding of the role of cerebral circulation in the regulation of environment within the neurovascular unit and for the BBB function. This new knowledge will contribute to the development of a new strategy for a therapeutic window of correction of the BBB disruption in pathological brain conditions associated with vascular abnormalities leading, to the malfunction of the neurovascular unit and long-lasting changes in neuronal activity.

    References

    [1] T. Broman. Acta Psych. Et Neurol., 16, 1(1941).

    [2] U. Friedemann. Physiol. Rev., 22, 125(1942).

    [3] W. M. Pardridge. Expert Opin. Drug Delivery, 13, 963(2016).

    [4] R. Spector, R. F. Keep, S. R. Snodgrass. Exp. Neurol., 267, 78(2015).

    [5] C. Joakim, B. D’Angelo, A. A. Baburamani, C. Lehner, A. L. Leverin. J. Cereb. Blood Flow Metab., 35, 818(2015).

    [6] O. Tomkins, O. Friedman, S. Ivens, C. Reiffurth, S. Major. Neurobiol. Dis, 25, 367(2007).

    [7] N. J. Abbott, A. Friedman. Epilepsia, 53, 1(2012).

    [8] E. A. Neuwelt. Neurosurgery, 54, 131(2004).

    [9] D. Fernandez-Lopez, J. Faustino, R. Daneman, L. Zhou, S. Y. Lee. J. Neurosci., 32, 9588(2012).

    [10] . Guide for the care and use of laboratory animals.(2011).

    [11] D. Briers, D. D. Duncan, E. Hirst, S. J. Kirkpatrick, M. Larsson. J. Biomed. Opt., 18, 066018(2013).

    [12] A. K. Dunn. Ann. Biomed. Eng., 40, 367(2012).

    [13] J. F. Muzy, E. Bacry, A. Arneodo. Phys. Rev. Lett., 67, 3515(1991).

    [14] J. F. Muzy, E. Bacry, A. Arneodo. Int. J. Bifurcation Chaos., 4, 245(1994).

    [15] A. N. Pavlov, O. N. Pavlova. Tech. Phys. Lett., 34, 306(2008).

    [16] P. Ch. Ivanov, L. A. Nunes Amaral, A. L. Goldberger, S. Havlin. Nature., 399, 461(1999).

    [17] A. Hoffmann. Transl. Stroke Res., 2, 106(2011).

    [18] S. Nag. Meth. Mol. Med., 89, 133(2003).

    [19] O. Semyachkina-Glushkovskaya, A. Pavlov, J. Kurths, E. Borisova, A. Gisbrecht, O. Sindeeva, A. Abdurashitov, A. Shirokov, N. Navolokin, V. Tuchin. Biomed. Opt. Express, 6, 4088(2015).

    [20] A. N. Pavlov, A. S. Abdurashitov, O. N. Pavlova, V. V. Tuchin, O. S. Sindeeva, S. S. Sindeev, O. V. Semyachkina-Glushkovskaya. J. Innov. Opt. Health Sci., 8, 1550041(2015).

    [21] P. K. Pandey, A. K. Sharma, U. Gupta. Tissue Barriers, 4, e1129476(2016).

    [22] O. Pragera, Y. Chassidima, C. Kleina, H. Levia, I. Shelefc, A. Friedmana. Neuroimage, 49, 337(2010).

    [23] C. J. Ek, B. D’Angelo, A. A. Baburamani, C. Lehner, A. L. Leverin. J. Cereb. Blood Flow Metab., 35, 818(2015).

    [24] H. Hagberg, M. A. Wilson, H. Matsushita, C. Zhu, M. Lange, M. Gustavsson. J Neurochem., 90, 1068(2004).

    [25] M. Hedtjärn, A. L. Leverin, K. Eriksson, K. Blomgren, C. Mallard, H. Hagberg. J. Neurosci., 22, 5910(2002).

    O. Semyachkina-Glushkovskaya, A. Abdurashitov, A. Pavlov, A. Shirokov, N. Navolokin, O. Pavlova, A. Gekalyuk, M. Ulanova, N. Shushunova, A. Bodrova, E. Saranceva, A. Khorovodov, I. Agranovich, V. Fedorova, M. Sagatova, A. E. Shareef, C. Zhang, D. Zhu, V. Tuchin. Laser speckle imaging and wavelet analysis of cerebral blood flow associated with the opening of the blood–brain barrier by sound[J]. Chinese Optics Letters, 2017, 15(9): 090002
    Download Citation