• Advanced Photonics
  • Vol. 4, Issue 5, 056004 (2022)
Pierre Didier1、2、†,*, Hamza Dely3, Thomas Bonazzi3, Olivier Spitz1、4, Elie Awwad1, Étienne Rodriguez3, Angela Vasanelli3, Carlo Sirtori3, and Frédéric Grillot1、5
Author Affiliations
  • 1Télécom Paris, Institut Polytechnique de Paris, LTCI, Palaiseau, France
  • 2mirSense, Centre d’integration NanoInnov, Palaiseau France
  • 3ENS, Université PSL, CNRS, Sorbonne Université, Université de Paris, Laboratoire de Physique de l’École Normale Supérieure, Paris, France
  • 4University of Central Florida, CREOL, College of Optics and Photonics, Orlando, Florida, United States
  • 5University of New Mexico, Center for High Technology Materials, Albuquerque, New Mexico, United States
  • show less
    DOI: 10.1117/1.AP.4.5.056004 Cite this Article Set citation alerts
    Pierre Didier, Hamza Dely, Thomas Bonazzi, Olivier Spitz, Elie Awwad, Étienne Rodriguez, Angela Vasanelli, Carlo Sirtori, Frédéric Grillot. High-capacity free-space optical link in the midinfrared thermal atmospheric windows using unipolar quantum devices[J]. Advanced Photonics, 2022, 4(5): 056004 Copy Citation Text show less
    Schematic of the full setup. A 9 μm wavelength CW QCL emits around 100 mW. The beam goes to an external modulator connected to DC and RF sources. The resulting signal passes through a 31-m Herriott cell before being collected on a high-speed detector and recorded with a fast oscilloscope.
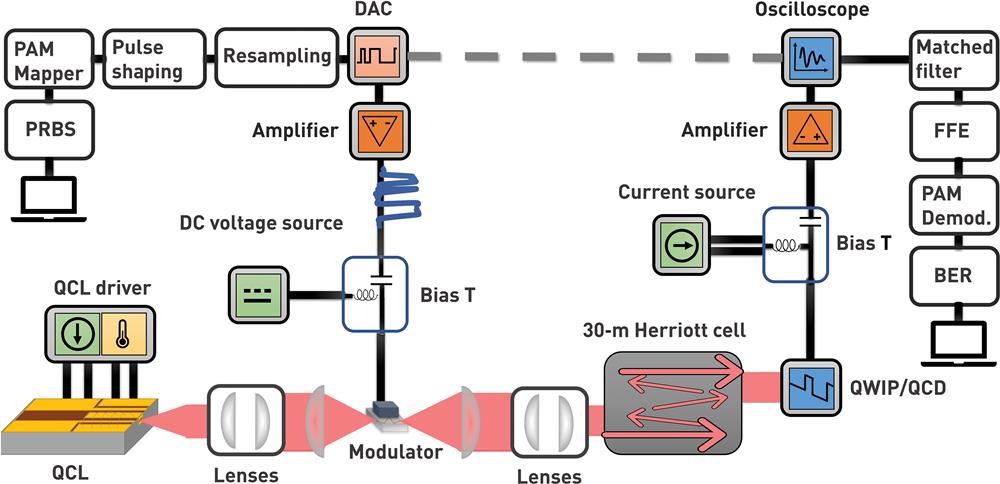
    Fig. 1. Schematic of the full setup. A 9  μm wavelength CW QCL emits around 100 mW. The beam goes to an external modulator connected to DC and RF sources. The resulting signal passes through a 31-m Herriott cell before being collected on a high-speed detector and recorded with a fast oscilloscope.
    (a) Picture of the connectorized external modulator on its mount with a coplanar waveguide. (b) Modulation depth estimated while measuring the signal voltage on the QCD when voltage pulses are applied on the modulator (blue dots). The measurements are well fitted with a Beer–Lambert law (solid curve). (c) QWIP biased at 4 V and showing a bandwidth >25 GHz with a heterodyne beating signal42" target="_self" style="display: inline;">42 (in red). We also display the electrical rectification of the QCD, showing a 3 dB bandwidth of 4.5 GHz (in blue).
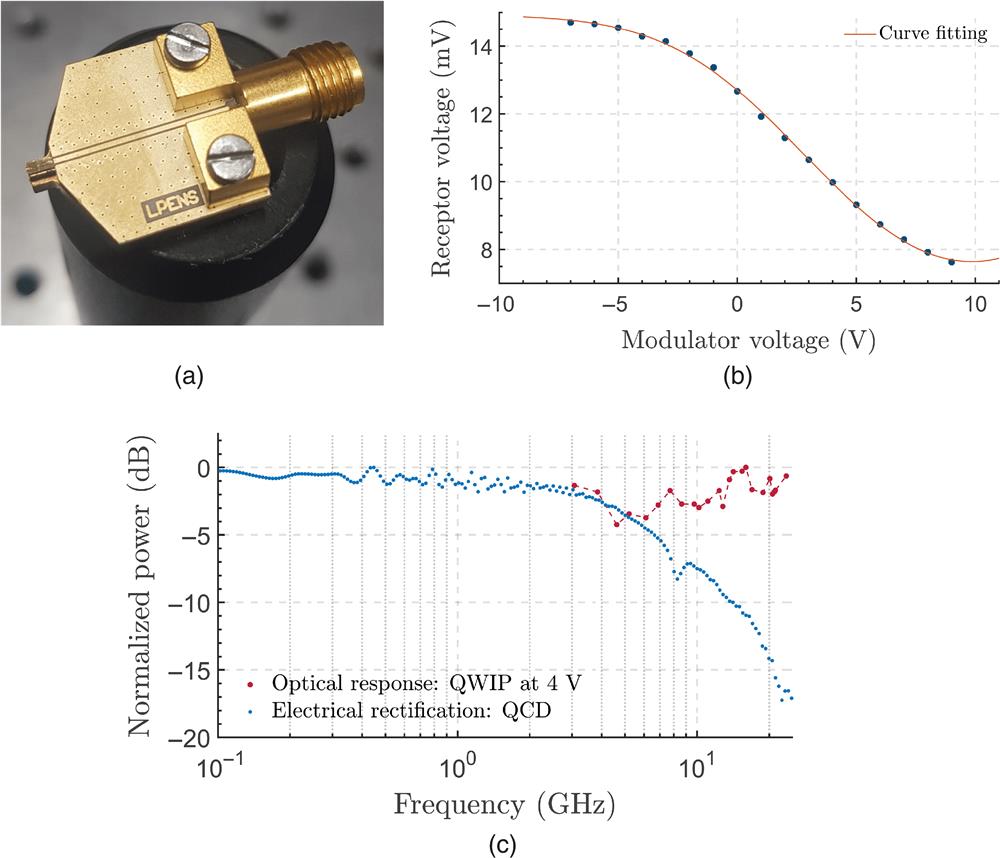
    Fig. 2. (a) Picture of the connectorized external modulator on its mount with a coplanar waveguide. (b) Modulation depth estimated while measuring the signal voltage on the QCD when voltage pulses are applied on the modulator (blue dots). The measurements are well fitted with a Beer–Lambert law (solid curve). (c) QWIP biased at 4 V and showing a bandwidth >25  GHz with a heterodyne beating signal42 (in red). We also display the electrical rectification of the QCD, showing a 3 dB bandwidth of 4.5 GHz (in blue).
    Bandwidth measurements. Optical response of the full system (modulator, QWIP, and amplifiers) measured using a VNA and injecting a 5 dBm signal in the modulator (green curve). In blue, the rectified current from the modulator when injecting a 0 dBm input signal. The gray curve represents the noise obtained in the same configuration while the midinfrared beam is blocked.
    Fig. 3. Bandwidth measurements. Optical response of the full system (modulator, QWIP, and amplifiers) measured using a VNA and injecting a 5 dBm signal in the modulator (green curve). In blue, the rectified current from the modulator when injecting a 0 dBm input signal. The gray curve represents the noise obtained in the same configuration while the midinfrared beam is blocked.
    Eye diagrams of transmission without processing for two different data rates using a QWIP. The figure shows the normalized voltage as a function of time: (a) 16 Gbit s−1 for a B2B transmission for a BER 0.38% and (b) 16 Gbit s−1 through a 31-m Herriott cell for a BER 4%.
    Fig. 4. Eye diagrams of transmission without processing for two different data rates using a QWIP. The figure shows the normalized voltage as a function of time: (a) 16  Gbits1 for a B2B transmission for a BER < 0.38% and (b) 16  Gbits1 through a 31-m Herriott cell for a BER < 4%.
    Comparison of the two eye diagrams (a) without and (b) with FFE equalization (ntap=391 and μ=1×10⁻⁵) at 30 Gbit s−1 with a 215-bit long PRBS in B2B configuration. FFE corrects systematic channel defects and intersymbol interference, hence opening the eye. (c) Eye diagrams for back-to-back transmission after equalization for a 27-bit long PRBS at 24 Gbit s−1.
    Fig. 5. Comparison of the two eye diagrams (a) without and (b) with FFE equalization (ntap=391 and μ=1×10⁵) at 30  Gbits1 with a 215-bit long PRBS in B2B configuration. FFE corrects systematic channel defects and intersymbol interference, hence opening the eye. (c) Eye diagrams for back-to-back transmission after equalization for a 27-bit long PRBS at 24  Gbits1.
    Eye diagrams of the transmission through a 31-m Herriott cell for three different data rates and a sequence length of 27 for the QCD and 215 for the QWIP. (a) QCD: 14 Gbit s−1 for a BER=0.21%. (b) QWIP: 30 Gbit s−1 for a BER=0.33%. (c) QWIP: 40 Gbit s−1 for a BER=2.5%. (d) Evolution of the BER (equalized and nonequalized) with respect to the baudrate for the QWIP transmission. The dashed lines recall BER limits for 7% HD-FEC (green) and 27% HD-FEC (cyan).
    Fig. 6. Eye diagrams of the transmission through a 31-m Herriott cell for three different data rates and a sequence length of 27 for the QCD and 215 for the QWIP. (a) QCD: 14  Gbits1 for a BER=0.21%. (b) QWIP: 30  Gbits1 for a BER=0.33%. (c) QWIP: 40  Gbits1 for a BER=2.5%. (d) Evolution of the BER (equalized and nonequalized) with respect to the baudrate for the QWIP transmission. The dashed lines recall BER limits for 7% HD-FEC (green) and 27% HD-FEC (cyan).
    (a) Eye diagram of a B2B equalized 27 PRBS transmission for the QCD with parameters (ntap=391, μ=1×10⁻⁴ with no RRC shaping) at 10 Gbit s−1. (b) Eye diagram of a 31-m equalized 27 PRBS transmission for the QWIP with parameters (ntap=391, μ=1×10⁻⁵ with no RRC shaping) at 24 Gbit s−1. (c) Eye diagram of a 31-m equalized 27 PRBS transmission for the QWIP with parameters (ntap=391, μ=1×10⁻⁵ with an RRC shaping with ρ=0.5) at 40 Gbit s−1.
    Fig. 7. (a) Eye diagram of a B2B equalized 27 PRBS transmission for the QCD with parameters (ntap=391, μ=1×10⁴ with no RRC shaping) at 10  Gbits1. (b) Eye diagram of a 31-m equalized 27 PRBS transmission for the QWIP with parameters (ntap=391, μ=1×10⁵ with no RRC shaping) at 24  Gbits1. (c) Eye diagram of a 31-m equalized 27 PRBS transmission for the QWIP with parameters (ntap=391, μ=1×10⁵ with an RRC shaping with ρ=0.5) at 40  Gbits1.
    Net data rates (Gbit/s)
    QCDQWIP
    OOKPAM4OOKPAM4
    Back to back (2 m)21 & 269 & 826 & 3021 & 33
    Herriott cell (31 m)12.5 & 1826 & 3021 & 30
    Table 1. Summary of results in terms of net data rates by taking into consideration overhead of the FEC (HD-FEC 7% and 27%) and the pilot sequence (5%) for equalized signal.
    Attenuation (dB/km)
    Visibility (km)1550 nm4000 nm9000 nm
    20 (Clear)0.20.060.02
    5 (Haze)1.20.470.2
    2 (Mist)421.1
    1 (Fog)9.35.43.3
    Table 2. Beam attenuation caused by the Mie scattering inspired by the table of Trichili et al.48
    Pierre Didier, Hamza Dely, Thomas Bonazzi, Olivier Spitz, Elie Awwad, Étienne Rodriguez, Angela Vasanelli, Carlo Sirtori, Frédéric Grillot. High-capacity free-space optical link in the midinfrared thermal atmospheric windows using unipolar quantum devices[J]. Advanced Photonics, 2022, 4(5): 056004
    Download Citation