
Ze Zheng, Lei Xu, Lujun Huang, Daria Smirnova, Khosro Zangeneh Kamali, Arman Yousefi, Fu Deng, Rocio Camacho-Morales, Cuifeng Ying, Andrey E. Miroshnichenko, Dragomir N. Neshev, Mohsen Rahmani. Third-harmonic generation and imaging with resonant Si membrane metasurface[J]. Opto-Electronic Advances, 2023, 6(8): 220174
- Opto-Electronic Advances
- Vol. 6, Issue 8, 220174 (2023)
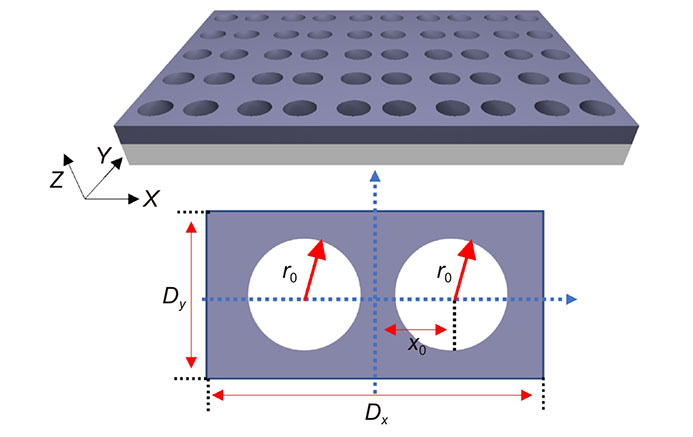
Fig. 1. Schematic representation of the designed silicon membrane metasurface. The radius of the hole r 0 is set as 100 nm. The period along x and y directions Dx and Dy are set as 600 nm and 300 nm, respectively. The offset x0 as the tunable factor is changed from 120 nm to 150 nm.
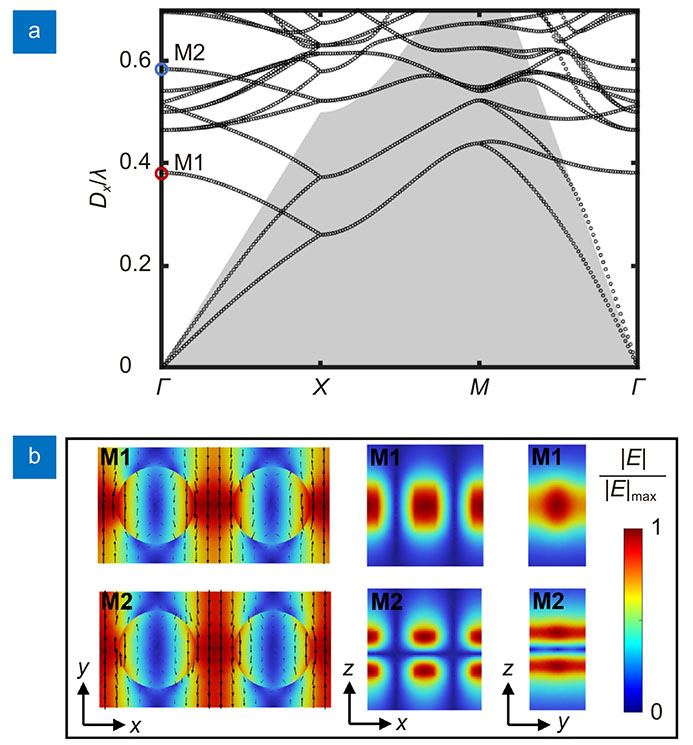
Fig. 2. (a ) Calculated bandgap structure for the metasurface with the positions of M1 (red circle) and M2 (blue circle) shown in the figure. (b ) Near-field electric distributions for the mode TE(3, 1, 1) and TE(3, 1, 2).
Fig. 3. Calculated linear transmission spectra (a1–a3 ), spherical (b1–b3 ), Cartesian multipolar structures (c1–c3 ) and electric energy enhancement (d1–d3 ) inside the silicon film for the case when the offset is 120 nm (a1–d1), 135 nm (a2–d2) and 150 nm (a3–d3), respectively. In the spherical multipolar expansion, the ED, MD, EQ, MQ, EO, MO respectively represent the electric dipole (ED) and magnetic dipole (MD), electric quadrupole (EQ) and magnetic quadrupole (MQ), electric octupole (EO) and magnetic octupole (MO). In the Cartesian multipolar expansion, the py and TD represent the electric dipole moment along the y-axis (py) and electric Toroidal moment (TD).
Fig. 4. (a ) SEM image of the fabricated sample. (b ) The experimentally measured. (c ) Simulated linear spectrum of the sample with offset being 135 nm.
Fig. 5. Measured linear spectra of metasurface samples with different offsets (a ), and experimentally measured linear spectra of the metasurface samples with different incident angles of pump (b ).
Fig. 6. (a ) The schematic of experimental setup for the THG imaging. The FS laser is the femtosecond laser. L1 is the aspheric lens that focus the beam into metasurfaces (MS). O1 is the 20× objective with NA=0.4. F1–F3 are the filters aiming to filter the near-infrared signal (F1) and control the intensity of the visible signal goes into the CCD camera (F2) and the spectrometer (F3). BS is the beam splitter. The target is imaged via the L1 to the plane, overlapping with the MS. The real image of the target and MS are imaged via the objective and then detected by the CCD camera (a CCD lens is included in the CCD camera). (b ) The experimentally measured THG spectra of the samples with the different offset x0.
Fig. 7. (a ) The schematic of THG imaging based on Si membrane metasurfaces. The near-infrared signal passes through the target, then being converted into the visible signal via the metasurfaces, forming the target image on the CCD camera. (b1 –e1 ) The images of the target and the metasurfaces under white light source illumination. (b2 –e2 ) Transformed visible images of the target via membrane metasurfaces under NIR light illumination. Here the greenish colour has been used to indicate the nonlinear radiation spectrum position (504 nm). The patterns at three different positions of the target are converted to visible images clearly by the metasurfaces.


Set citation alerts for the article
Please enter your email address

© Copyright 2018-2021 | Chinese Laser Press. All Rights Reserved 沪ICP备15018463号-20