• Spectroscopy and Spectral Analysis
  • Vol. 42, Issue 5, 1433 (2022)
Li-qi WANG1、*, Jing YAO1、1;, Rui-ying WANG1、1;, Ying-shu CHEN1、1;, Shu-nian LUO2、2;, Wei-ning WANG2、2;, and Yan-rong ZHANG1、1; *;
Author Affiliations
  • 11. School of Computer and Information Engineering, Harbin University of Commerce, Heilongjiang Provincial Key Laboratory of E-commerce and Information Processing, Harbin 150028, China
  • 22. School of Food Engineering, Harbin University of Commerce, Harbin 150028, China
  • show less
    DOI: 10.3964/j.issn.1000-0593(2022)05-1433-06 Cite this Article
    Li-qi WANG, Jing YAO, Rui-ying WANG, Ying-shu CHEN, Shu-nian LUO, Wei-ning WANG, Yan-rong ZHANG. Research on Detection of Soybean Meal Quality by NIR Based on PLS-GRNN[J]. Spectroscopy and Spectral Analysis, 2022, 42(5): 1433 Copy Citation Text show less
    Near infrared spectra of soybean meal samples
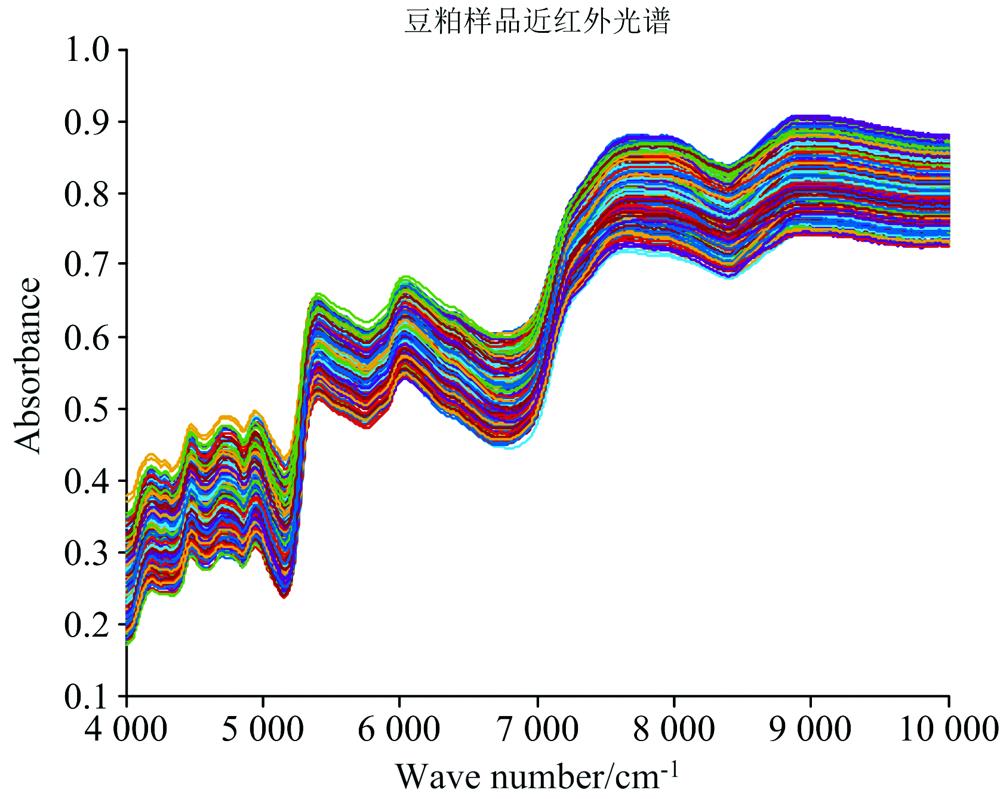
    Fig. 1. Near infrared spectra of soybean meal samples
    iPLS modeling results of 20 subintervals for moisture
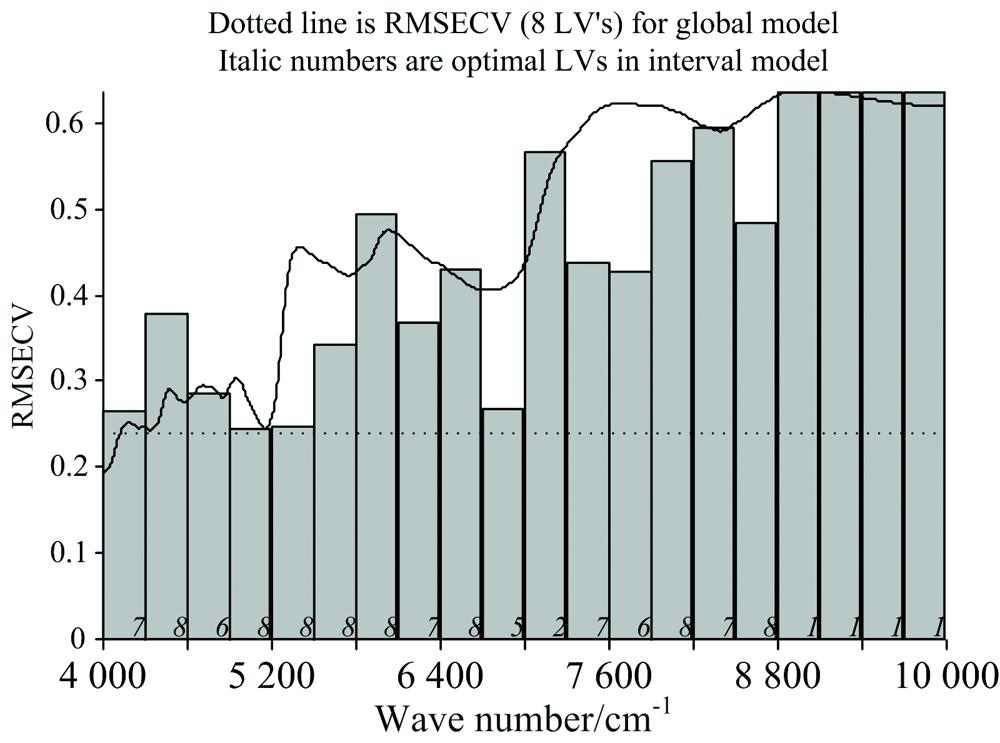
    Fig. 2. iPLS modeling results of 20 subintervals for moisture
    iPLS modeling results of 20 subintervals for protein
    Fig. 3. iPLS modeling results of 20 subintervals for protein
    iPLS modeling results of 20 subintervals for fat
    Fig. 4. iPLS modeling results of 20 subintervals for fat
    Structure of GRNN
    Fig. 5. Structure of GRNN
    The changing trends of PRESS with the major factors
    Fig. 6. The changing trends of PRESS with the major factors
    Optimizing curves of spread
    Fig. 7. Optimizing curves of spread
    Predictive effects of PLS-GRNN models for moisture, protein and fat
    Fig. 8. Predictive effects of PLS-GRNN models for moisture, protein and fat
    去噪方法percerr
    小波去噪(db6、 2层分解、 penalty阈值)0.999 90.000 5
    移动平均法0.999 80.001 6
    多元散射校正0.999 70.090 4
    标准正态变量变换0.998 50.111 0
    Table 1. Comparison of statistical results of various noise reduction methods
    分集方法指标校正集预测集
    R2RMSECR2RMSEPRSD/%
    水分0.922 40.239 10.917 30.242 92.11
    KS蛋白质0.914 70.571 70.910 60.511 21.10
    脂肪0.875 80.154 00.839 90.178 816.83
    水分0.906 40.243 20.896 40.251 92.20
    SPXY蛋白质0.933 10.498 30.908 20.522 31.13
    脂肪0.852 40.161 00.891 90.145 013.10
    Table 2. Modeling results of two sample set partitioning methods
    指标样本集数目
    /个
    最小值
    /%
    最大值
    /%
    均值
    /%
    标准差
    /%
    水分校正集2789.7912.8211.4370.646 7
    预测集809.9712.7611.5100.603 5
    蛋白质校正集27841.250.946.3741.494 7
    预测集8041.449.246.4361.577 7
    脂肪校正集2780.442.491.0440.352 1
    预测集800.452.411.1070.351 8
    Table 3. Sample partition results
    参数指标子区间数最佳建模波段/cm-1R2RMSECV
    水分204 904~5 2000.926 90.242 4
    305 204~5 4000.924 10.246 8
    405 216~5 3640.913 60.262 6
    504 844~4 9600.921 50.250 9
    Table 4. iPLS waveband selection results of moisture for different subinterval number
    参数指标子区间数最佳建模波段/cm-1R2RMSECV
    蛋白质204 304~4 6000.939 60.510 8
    304 404~4 6000.929 90.549 7
    404 456~4 6040.928 70.554 0
    504 484~4 6000.930 60.546 7
    Table 5. iPLS waveband selection results of protein for different subinterval number
    参数指标子区间数最佳建模波段/cm-1R2RMSECV
    脂肪204 304~4 6000.875 90.170 2
    305 604~5 8000.869 90.174 0
    404 304~4 4520.872 30.172 7
    504 204~4 3600.872 70.172 6
    Table 6. iPLS waveband selection results of fat for different subinterval number
    参数指标建模方法R2RMSEPRSD/%
    PLS0.917 30.242 92.11
    水分BP0.957 20.124 81.08
    PLS-GRNN0.976 90.091 20.79
    PLS0.910 60.511 21.10
    蛋白质BP0.921 90.440 90.95
    PLS-GRNN0.940 20.383 40.83
    PLS0.891 90.145 013.10
    脂肪BP0.909 30.115 310.90
    PLS-GRNN0.911 10.113 48.53
    Table 7. Comparison of modeling effects between PLS-GRNN and PLS, BP
    Li-qi WANG, Jing YAO, Rui-ying WANG, Ying-shu CHEN, Shu-nian LUO, Wei-ning WANG, Yan-rong ZHANG. Research on Detection of Soybean Meal Quality by NIR Based on PLS-GRNN[J]. Spectroscopy and Spectral Analysis, 2022, 42(5): 1433
    Download Citation