A novel magnetic field sensing system based on the fiber loop ring-down technique is proposed in this paper. In the fiber loop, a U-bent single-mode-fiber structure coated with magnetic fluid (MF) serves as the sensing head, and an erbium-doped fiber amplifier (EDFA) is introduced to compensate for the intrinsic loss of the cavity. The ring-down time of the system varies with the change of applied magnetic field due to the tunable absorption coefficient and refractive index of the MF. Therefore, measurement of the magnetic field can be realized by monitoring the ringdown time. The experimental results show that the performance of the system is extremely dependent on the interrogation wavelength, because both the gain of the EDFA and the loss of the sensing head are wavelength dependent. We found that at the optimal wavelength, the ratio of the gain to loss attained its maximum. The sensing system was experimentally demonstrated and a sensitivity of ?0.5951 μs∕Oe was achieved.61107035).
The fiber loop ring-down (FLRD) technique, a universally applicable time-domain sensing scheme, has attracted much interest in recent years due to its advantages of high detection sensitivity, simple configuration, etc. [1]. Unlike a conventional intensity-interrogated sensing mechanism, the FLRD technique measures the ring-down time of a pulse train rather than the change of intensity. Consequently, the result is immune to the intensity fluctuation of the light source as well as other external loss contributions, thus enhancing the stability of the sensing system [2]. Integrated with various sensing heads, FLRD can realize measurements of different parameters, including refractive index of liquids [3–6], pressure [7,8], curvature [9], macro-bend loss of single-mode fiber (SMF) [10], and the concentration of gas [11]. In particular, by coating a piece of etched SMF with magnetic fluid (MF), a kind of liquid nanomaterial with outstanding magneto-optical effects, magnetic field sensing based on the FLRD technique was recently demonstrated by Wang et al.[12] and Shen et al.[13]. The introduction of the FLRD technique significantly enhances the sensitivity and stability when comparing with the conventional intensity-interrogated magnetic field sensors based on MF and various fiber structures, for example up-taper joints [14], thin-core fibers [15], multimode interferometers [16], and photonic crystal fiber [17].
However, in [12,13], to enable evanescent field interaction with the surrounding MF, part of the SMF cladding was removed by HF etching, which increases the difficulty of fabrication. In our previous work, we reported a simple way to enable evanescent field interaction with the surrounding medium by mechanically bending an SMF, demonstrating an intensity-interrogated magnetic field sensor composed of a piece MF-coated U-bent SMF [18].
In this paper, an MF-coated U-bent SMF structure was introduced into an FLRD cavity to realize magnetic field sensing by measuring the ring-down time instead of the intensity change. To enhance detection sensitivity, an erbium-doped fiber amplifier (EDFA) was introduced to increase the pulse number in the first decay train within a time constant. Because of the wavelength-dependent gain of the EDFA and the loss induced by the sensing head, the performance of the sensor depends greatly on the interrogation wavelength, which was experimentally investigated, and the corresponding physical mechanism was discussed. The results show that at the optimal wavelength, the ratio of gain to loss attains its maximum. A sensitivity of μ in the linear range from 0 to 80 Oe was achieved in the experiments. Our work is this paper can provide some useful reference in the FLRD-based sensing area.
Sign up for Photonics Research TOC. Get the latest issue of Photonics Research delivered right to you!Sign up now
2. WORKING PRINCIPLES
A. Working Principles of the Sensing System
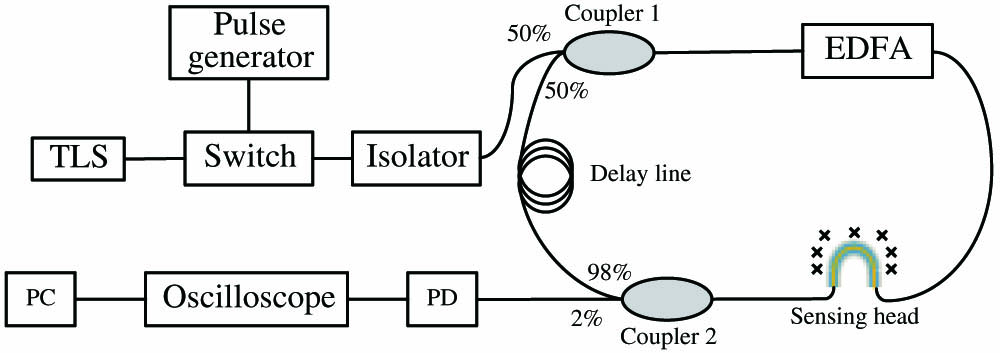
The schematic diagram of the proposed magnetic field sensing system is shown in Fig. 1. The coupling ratios of coupler 1 and coupler 2 are ∶ and ∶, respectively. A gain-adjustable L-band EDFA, an MF-coated U-bent SMF structure, and a fiber delay line are connected between the two couplers to form the loop. The EDFA is introduced to compensate for the loss of the fiber loop. Optical pulses are generated by externally modulating the continuous wavelength output of a tunable laser source (TLS, AQ8640) by an optical switch, which is triggered by a signal generator (Agilent 33220A). The pulses are injected into the fiber loop via one arm of coupler 1 after passing an isolator. The periodically decayed pulse train is detected by a photodiode (PD, DET01CFC, Thorlabs) at the 2% arm of coupler 2 and recorded by a digital oscilloscope (TDS 2022B, Tektronix). Finally, the signals are sent to a personal computer (PC) for data processing.
The peak intensity of the detected signal pulses follows an exponential decay with time. The relation between the light intensity at time and the initial light intensity can be described as [13]where is the speed of light in vacuum, and are the average refractive index and the length of the fiber loop, respectively, and is the total loss of the cavity, which can be expressed as the sum of three parts: where represents the intrinsic loss of the fiber loop (including the insertion losses of the fiber couplers, the fiber absorption loss, and the fiber scattering loss), represents the gain of the EDFA, and is the loss introduced by the sensing head. The ring-down time is defined as the time at which decreases to of . From Eqs. (1) and (2), the ring-down time can be given by
B. Working Principles of the Sensing Head
Figure 2 shows the schematic of the sensing head. A piece of coating-stripped SMF (SMF-28, Corning) is bent to a shape with a diameter of and sealed in a tube filled with MF (EMG-605, Ferrotec Inc.). In this paper, the diameter of the U shape, i.e., the in Fig. 2, is 8 mm. The underlying working principle of the sensing head can be briefly described as follows: when light propagates to the bent section, leaky modes and cladding modes will be excited because of the bending [19]. The leaky modes will introduce an extra loss, whereas the cladding modes will be constrained in the fiber, because the refractive index of the MF is smaller than that of the cladding. Meanwhile, the large absorption coefficient of the MF will lead to a remarkable intensity loss to these modes through the absorption of their evanescent field [18]. After passing through the U-bent section, the cladding modes will be partly coupled back to the core. Thus, mode interference between the cladding modes and the core mode will occur in the straight lead-out SMF.
Figure 2.Schematic of the sensing head based on an MF-coated U-bent fiber structure.
The transmission loss caused by the sensing head at wavelength can be described as where , , , and represent the light intensity of the total modes, leaky modes, core mode, and cladding modes at the initiating terminal of the U-bent section, respectively; is the percentage of the intensity carried by the evanescent field to the intensity of the cladding modes; is the absorption coefficient of the MF; is the length of U-bent section; and represents the phase difference between the core mode and the cladding modes, and can be expressed by where and are the effective refractive indices of the core mode and cladding modes, respectively. In the right side of Eq. (4), the first term represents the loss caused by the leaky modes, and the second term contains the losses induced by the evanescent absorption and mode interference.
When a magnetic field is applied to the MF, both the absorption coefficient and refractive index of the MF will change because of the agglomeration of magnetic nanoparticles and the formation of chain-like clusters under an external magnetic field [16]. Consequently, in Eq. (4) and in Eq. (5) will also have a change, which will lead to a variation of in Eq. (4). For a given fiber loop and a fixed gain of the EDFA, namely, and in Eq. (3) are fixed, will depend only on , which is sensitive to the applied magnetic field strength (). Therefore, magnetic field sensing can be achieved by measuring the ring-down time .
3. INFLUENCE OF WAVELENGTH
The detection sensitivity, i.e., the minimum detectable optical loss , of an FLRD-based sensing system can be described by [5] where is the number of pulses in the first decay train within the ring-down time , and and are the averaged value and the one-sigma standard deviation of ring-down time , respectively. For a given fiber loop length, we can see from Eq. (6) that a larger can help enhance the detection sensitivity. Therefore, an L-band EDFA module is introduced here, as shown in Fig. 1, to compensate for the intrinsic loss, thus increasing . In practice, the gain of an EDFA is dependent on the signal wavelength. Due to mode interference, the transmission loss of the sensing head is also wavelength dependent. By employing the experimental setups shown in Fig. 3, the gain characteristic curve of the EDFA and the transmission spectra of the sensing head were measured, and the results are shown in Fig. 4. We can see that the highest gain of the EDFA is at 1570 nm, which is different from the 1575.8 nm with the minimum loss of the sensing head.
Figure 3.Schematic diagrams for measuring (a) the gain characteristic of the EDFA module depending on wavelength and (b) the transmission spectrum of the sensing head in the MF under 0 Oe. OPM, optical powermeter; BBS, broadband source (Lightcomm Tecnologia Ltd.); OSA, optical spectrum analyzer (Advantest Q8384).
To investigate the influence of the wavelength dependence of the sensing system, as shown in Fig. 1, experiments were performed by tuning the output wavelength of the TLS from 1555 to 1580 nm with a step of 5 nm. At each wavelength, the gain of the EDFA was gradually increased from 0 dB, and the evolution of the output pulses was recorded (for details please see Visualization 1, Visualization 2, Visualization 3, Visualization 4, Visualization 5, and Visualization 6). We find that, at all the investigated wavelengths, with the increasing of the gain, the pulse number in the decay train will increase initially; at a certain point, the pulse number reaches the maximum, but further increase of the gain will aggravate signal deformation and noise until the signal pulses are totally submerged. This phenomenon can be explained as follows. Initially, the increasing gain from the EDFA helps compensate for the total loss of the fiber loop and to increase the number of loop rounds of the light. When the gain increases to be very close to the lasing threshold of the fiber loop, namely, is slightly lower than , the number of pulses reaches the maximum value. However, a further increase of gain will lead to the emergence of relaxation oscillations [20], which decrease the gain to the signal train and deform its profile, because the gain exceeds the lasing threshold, i.e., is higher than . So the signal-to-noise ratio will decrease with further increase of the EDFA gain, until the signal pulses ultimately submerge in the disordered relaxation oscillations and noise.
In addition to the above common characteristics, we can also see from Visualization 1, Visualization 2, Visualization 3, Visualization 4, Visualization 5, and Visualization 6 that, for different wavelengths, the maximum numbers of pulses in their decay trains are also different. For example, at 1560 nm there are only two pulses, whereas at 1575 nm the number of pulses is more than 35. This is because 1575 nm is not only near the peak of the gain spectrum of the EDFA, but also close to the transmission peak of the sensor head. This enables almost all the loss to be compensated for by the EDFA before reaching the lasing threshold. However at 1560 nm, due to the high loss of the sensor head, the gain of the EDFA is not enough to compensate for the loss, so the number of pulses is much smaller.
Based on the above discussions, it is clear that the performance of the sensing system at a certain wavelength depends on both the gain of the EDFA and the loss of the sensing head. An ideal situation is that the peak wavelengths of the gain spectrum of the EDFA and the transmission spectrum of the sensing head are identical, so the peak wavelength will be the optimal one. However, it is difficult to realize in practice, especially for cases in which an interferometer works as the sensing head. To quantitatively assess the influence of wavelength, we introduce the quality factor , which is defined as the normalized radio of the normalized gain of the EDFA to the loss induced by the sensing head, i.e., the normalization of . Table 1 shows the values of , , , and at different wavelengths. is the maximum number of pulses in a decay train, and it is proportional to the maximum pulse number within the ring-down time for a given fiber loop. As shown in Table 1, a larger means a higher attainable number of pulses in the decay train. At 1575 nm, attains its maximum, thus 1575 nm is the optimal wavelength for the sensing system in this paper.
λ (nm)
1555
1560
1565
1570
1575
1580
Gnor
0.90
0.95
0.98
1.00
0.98
0.94
V (dB)
10.41
9.04
7.13
5.87
5.49
5.78
N
1
2
7
>35
>35
14
Q
0.49
0.59
0.77
0.96
1.00
0.91
Table 1. Values of , , , and at Different Wavelengths
A. Spectral Response of the Sensing Head to the Magnetic Field
The spectral response of the sensing head to the magnetic field was measured by using the experimental setup shown in Fig. 3(b). The magnetic field generated by an electromagnet was perpendicularly applied to the surface of the sensing head, and its strength was controlled by adjusting the current. Figure 5(a) shows the measured results. We can see that the each spectrum features one dip and one peak due to the mode interference between the core mode and cladding modes in the U-bent fiber. From Fig. 5(a), we can also see that, with the increase of , both the dip and the peak show a redshift while their transmittances are also changed. This is because the refractive index and the absorption coefficient of the MF increase with [16].
Figure 5.(a) Spectral response of the sensing head to the applied magnetic field. (b) The transmittance change at 1575 nm depending on .
At 1575 nm, which has the highest , the transmittance change as a function of was calculated and plotted in Fig. 5(b). Overall, the transmittance decreases with the increase of . The maximum transmittance change is about 1.3 dB at 250 Oe. However, apparent fluctuations can also be observed on the curve, especially in the range from 200 to 250 Oe. This means that the results obtained by the intensity-based demodulation method will suffer from other external disturbance, including the intensity fluctuation of the light source.
B. Measurements Based on the FLRD Technique
After splicing the sensing head into the FLRD cavity, measurements based on the FLRD technique were conducted with the experimental setup shown in Fig. 1. The output wavelength and pulse width of the TLS were tuned as 1575 nm and 2 μs, respectively. The interval time of the output pulses from TLS is 1 ms, which is enough to avoid the overlap of two adjacent decay trains. The gain of the EDFA was properly adjusted until the number of pulses reached the maximum. The output decay train at 0 Oe is shown in Fig. 6(a). The decay train contains 10 pulses within the time constant of 72.4 μs, and the interval between two adjacent pulses is μ, from which the length of the whole loop can be estimated to be . Then was gradually increased to 250 Oe with a step of 10 Oe, and the output signal under 250 Oe is shown in Fig. 6(b). The exponential fitting results show that the ring-down time decreased from 72.4227 to 1.6063 μs when changed from 0 to 250 Oe.
Figure 6.Output decay trains and the corresponding exponent fittings of the peaks under of (a) 0 and (b) 250 Oe.
To reduce measurement error, the experiments were repeated three times at room temperature, and the corresponding ring-down time as a function of was calculated. The results are shown in Fig. 7. We can find some deviation for the three measurements, which is potentially attributed to the hysteresis effect of the MF. The inset shows the averaged curve based on the three measurements and its fitting results. From the results we can see that the ring-down time decreases monotonically with the increase of . As a whole, the data exhibit a nonlinear relationship and can be fairly well fitted with a cubic polynomial. In the subrange from 0 to 80 Oe, it has good linearity (adjusted ) with a slope (or sensitivity) of μ, which is higher than the 0.0796 μs/Oe (the reciprocal of 12.56 Oe/μs) in [12] and the 0.0096 μs/Oe in [13].
Figure 7.Measured ring-down time depending on . Inset: the statistics and fitting results.
Comparing Figs. 5(b) and 7, we can see that the curves in Fig. 7 tend to saturate at 180 Oe, whereas the curve in Fig. 5(b) does not perform saturation even at 250 Oe, which agrees well with the nonlinear relationship between and as shown in Eq. (3). This also indicates that employing the FLRD technique may reduce the range of measurable . But the FLRD technique has two advantages over the intensity demodulation method. First, it can significantly relieve the external disturbance, which can be evidenced from the smoother curves in Fig. 7. Second, it can provide a 10 times higher detection sensitivity than that of the intensity-interrogated method, where 10 is the number of pulses in the first decay train within the ring-down time [5].
5. CONCLUSION
In summary, a novel sensing system employing FLRD technique for magnetic field measurement was proposed and experimentally investigated. An MF-coated U-bent fiber structure was inserted into a fiber loop to serve as the sensing head, and an EDFA was introduced to compensate for the cavity loss and increase the pulse number in the decay train. Because of the magnetic-field-sensitive refractive index and absorption coefficient of the MF, the ring-down time changes with the magnitude of the applied magnetic field. Therefore, the magnetic field can be measured by calculating the ring-down time of the decayed pulse trains. The influence of the interrogation wavelength was analyzed. Because both the loss of the sensing head and the gain of the EDFA are wavelength dependent, the performance of the system is also dependent on the interrogation wavelength. We found that, at the optimal wavelength, the ratio of gain to loss reached its maximum. A sensing system was experimentally demonstrated and a sensitivity of μ was achieved. Our work in this paper can provide some useful reference in the FLRD-based sensing area.
[14] P. Shengli, D. Shaohua. Magnetic field sensing based on magnetic-fluid-clad fiber-optic structure with up-tapered joints. IEEE Photon. J., 6, 5300206(2014).