• Infrared and Laser Engineering
  • Vol. 49, Issue 8, 20190576 (2020)
Jin Wang1, Xianwei Hao2, Jungang Dong3, Jijun Xiong1, and Yingping Hong1、*
Author Affiliations
  • 1Key Laboratory of Instrumentation Science and Dynamic Measurement, Ministry of Education, North University of China, Taiyuan 030051, China
  • 2Beijing Institute of Astronautical Systems Engineering, Beijing 100171, China
  • 3Beijing Capital Aerospace Machinery Co., Ltd. Beijing 100076, China
  • show less
    DOI: 10.3788/IRLA20190576 Cite this Article
    Jin Wang, Xianwei Hao, Jungang Dong, Jijun Xiong, Yingping Hong. Design of high precision photoionization detector[J]. Infrared and Laser Engineering, 2020, 49(8): 20190576 Copy Citation Text show less
    Schematic view of PID sensing principle
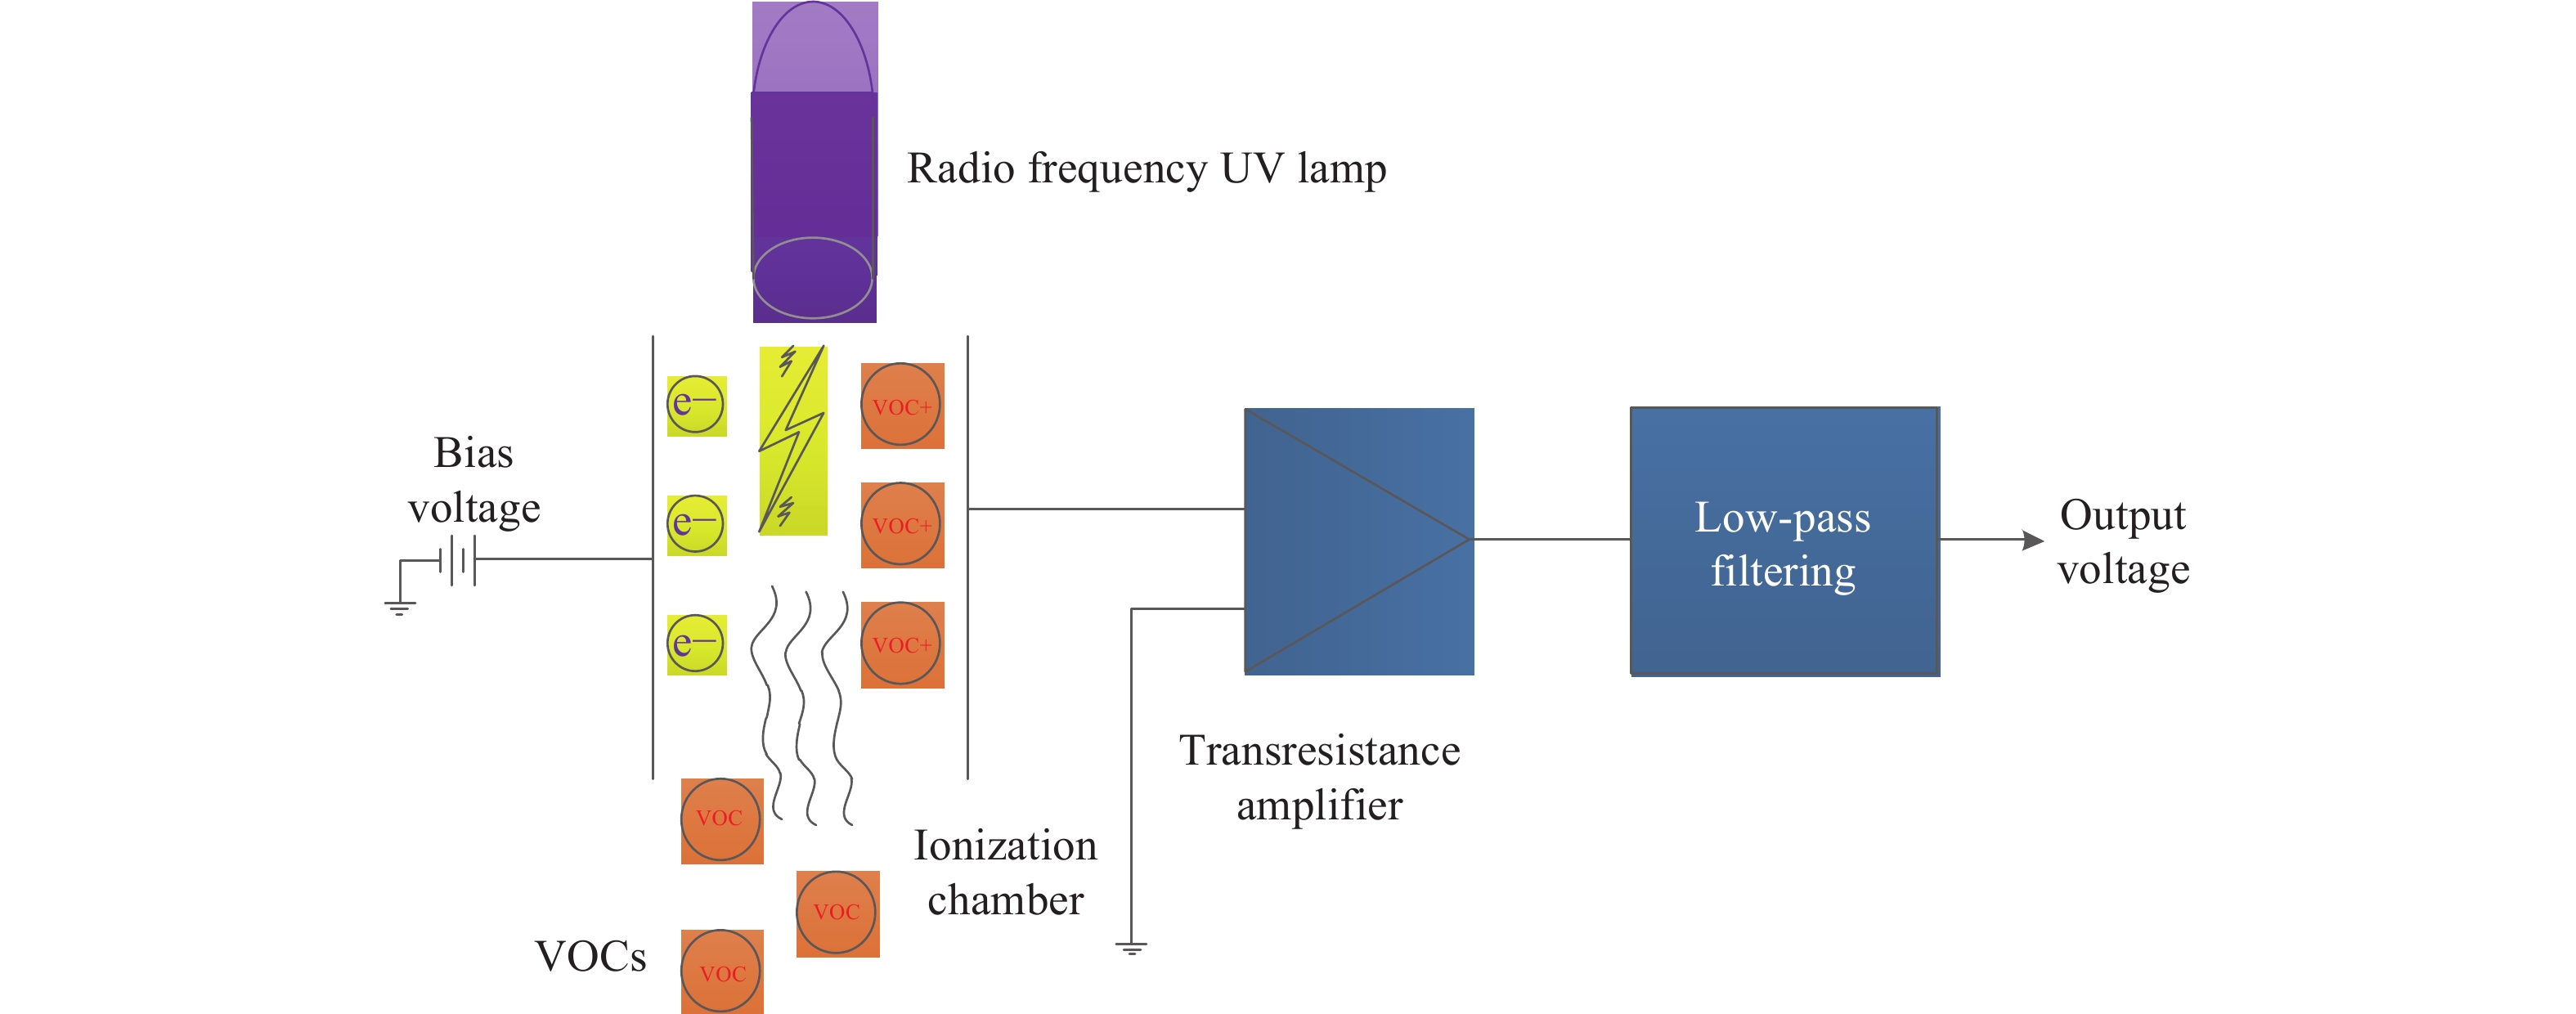
    Fig. 1. Schematic view of PID sensing principle
    System hardware ciucuit diagram. (a) Weak current detection module and UV lamp drive module circuit diagram, (b) system block view of the whole circuit
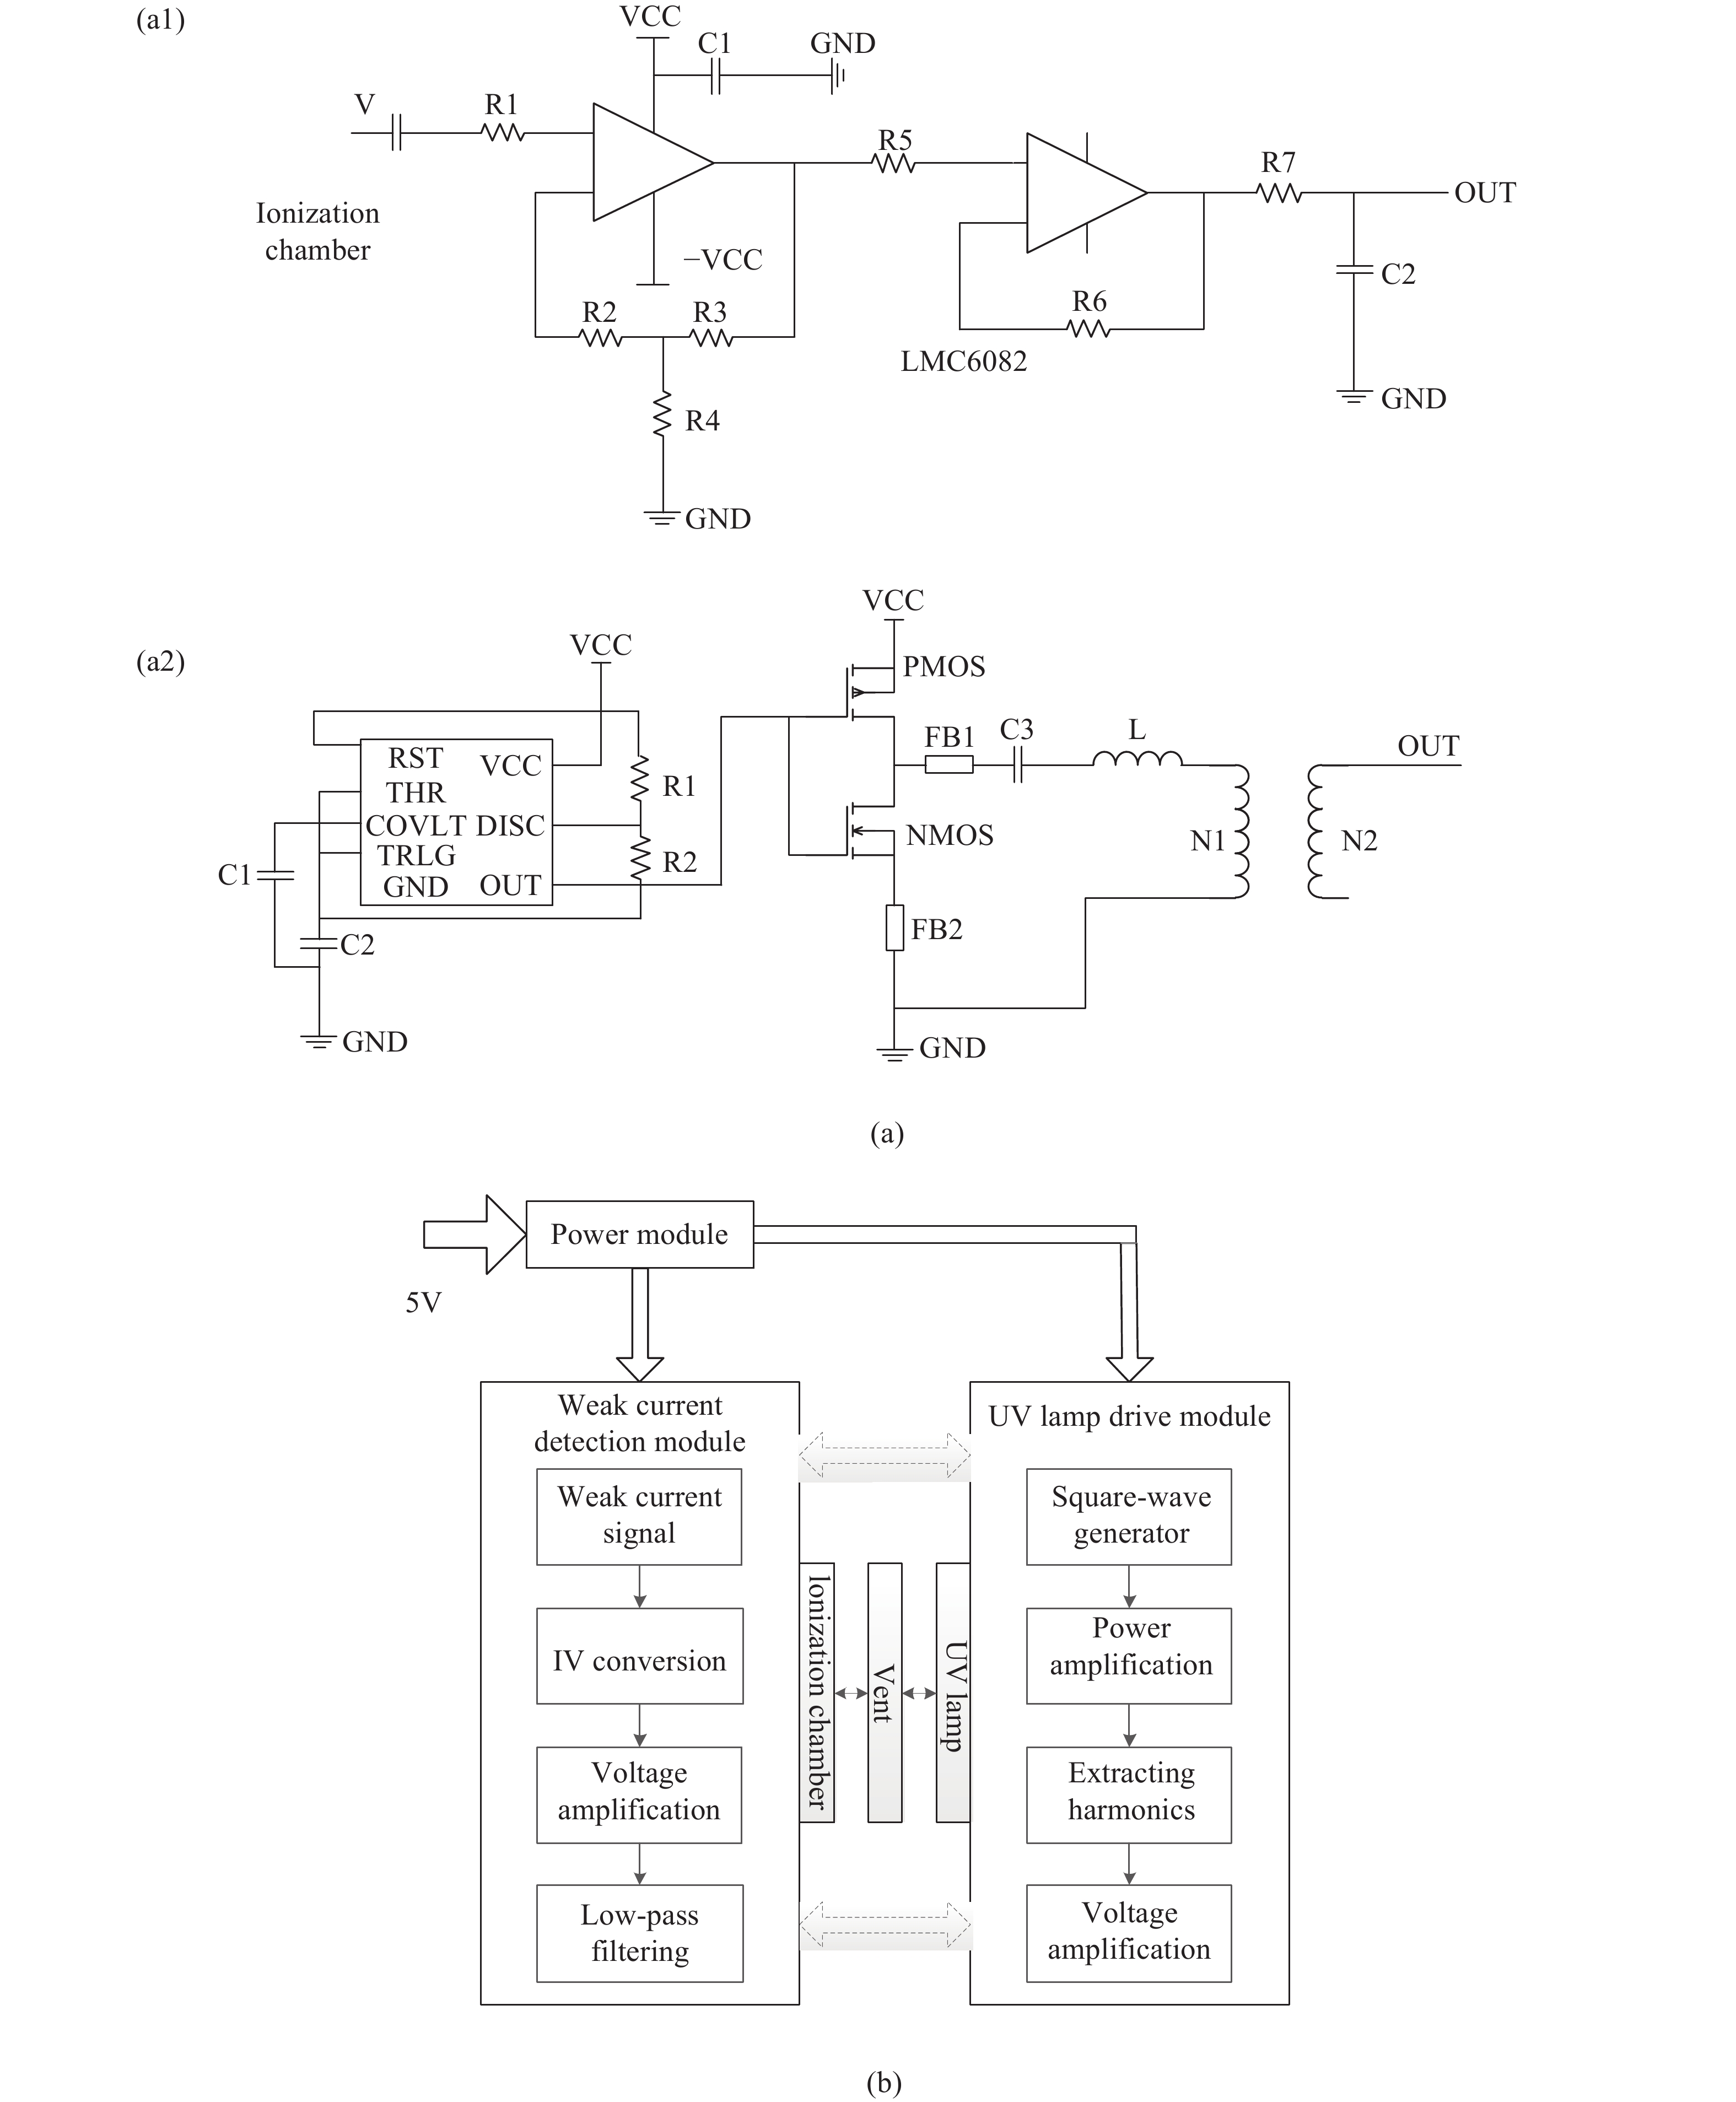
    Fig. 2. System hardware ciucuit diagram. (a) Weak current detection module and UV lamp drive module circuit diagram, (b) system block view of the whole circuit
    External package view of PID. (a) External package structure view of the PID, (b) external package physical view of the PID
    Fig. 3. External package view of PID. (a) External package structure view of the PID, (b) external package physical view of the PID
    Measurement system of PID. (a) Architecture view of the PID measurement system, (b) physical view of the PID measurement system)
    Fig. 4. Measurement system of PID. (a) Architecture view of the PID measurement system, (b) physical view of the PID measurement system)
    Curve diagram and fitting diagram of the experimental output voltage. (a) Curve diagram of the values measured for seven times, (b) curve diagram of the average output point and the curve diagram by linear fit
    Fig. 5. Curve diagram and fitting diagram of the experimental output voltage. (a) Curve diagram of the values measured for seven times, (b) curve diagram of the average output point and the curve diagram by linear fit
    Experimental results of repeatability. (a) Measurement curve of repeatability, (b) concentration curve of reverse-acting gas
    Fig. 6. Experimental results of repeatability. (a) Measurement curve of repeatability, (b) concentration curve of reverse-acting gas
    Concentrations of isobutene /ppmV1/mV V2/mV V3 /mV V4 /mV V5 /mV V6 /mV V7 /mV Average value of voltage /mV
    29.79321.4305.2333300309.3303.1323.3313.61
    60.45491478.8477482.3486.9493.5486.5485.14
    142.111 018.1983.1963935.1907.7955.5929955.93
    204.011 205.11 228.31 242.81 235.11 256.71 277.71 232.51 239.74
    Table 1.

    Voltage of seven groups of repeated tests at different concentrations of isobutene

    不同异丁烯气体浓度时,七组重复试验的电压值

    Concentrations of isobutene /ppmOutput voltage /mVRetrieving concentrations of isobutene /ppm
    29.79308.328.76
    60.45493.062.97
    142.11927.7143.50
    204.011 264205.80
    Table 2.

    Reversing experiment results of standard isobutene measurement

    标准异丁烯测量反演实验结果

    Jin Wang, Xianwei Hao, Jungang Dong, Jijun Xiong, Yingping Hong. Design of high precision photoionization detector[J]. Infrared and Laser Engineering, 2020, 49(8): 20190576
    Download Citation