• Photonics Research
  • Vol. 10, Issue 11, 2599 (2022)
Huicong Li1、2, Wenzhu Huang1、3, Wentao Zhang1、2、*, and Jianxiang Zhang1、2
Author Affiliations
  • 1State Key Laboratory of Transducer Technology, Institute of Semiconductors, Chinese Academy of Sciences, Beijing 100083, China
  • 2College of Materials Science and Opto-Electronic Technology, University of Chinese Academy of Sciences, Beijing 100049, China
  • 3Shenzhen Academy of Disaster Prevention and Reduction, Shenzhen 518003, China
  • show less
    DOI: 10.1364/PRJ.468283 Cite this Article Set citation alerts
    Huicong Li, Wenzhu Huang, Wentao Zhang, Jianxiang Zhang. Fiber optic strain rate sensor based on a differentiating interferometer[J]. Photonics Research, 2022, 10(11): 2599 Copy Citation Text show less
    Fiber optic strain rate sensor system. ASE, amplified spontaneous emission light source; ISO, isolator; CIR, circulator; 3×3 OC, 3×3 optical coupler; 1×2 OC, 1×2 optical coupler; FRM, Faraday rotator mirror. Demodulator integrates photodetectors, analog input modules, and embedded controllers. Red and blue lines represent optical fibers and communication cables, respectively.
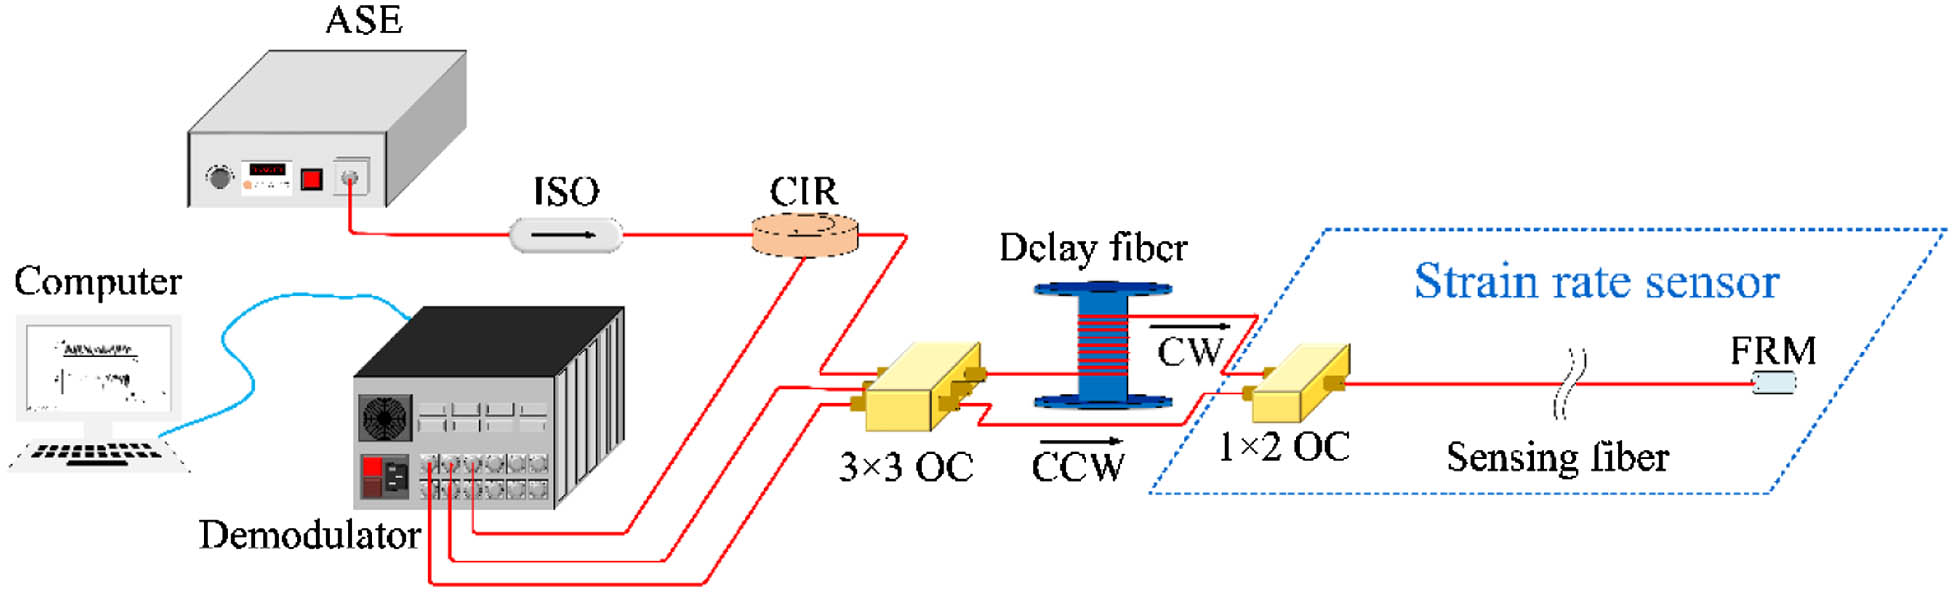
    Fig. 1. Fiber optic strain rate sensor system. ASE, amplified spontaneous emission light source; ISO, isolator; CIR, circulator; 3×3 OC, 3×3 optical coupler; 1×2 OC, 1×2 optical coupler; FRM, Faraday rotator mirror. Demodulator integrates photodetectors, analog input modules, and embedded controllers. Red and blue lines represent optical fibers and communication cables, respectively.
    Demonstration of (a) three detection optical signals and (b) simulated strain rate and phase.
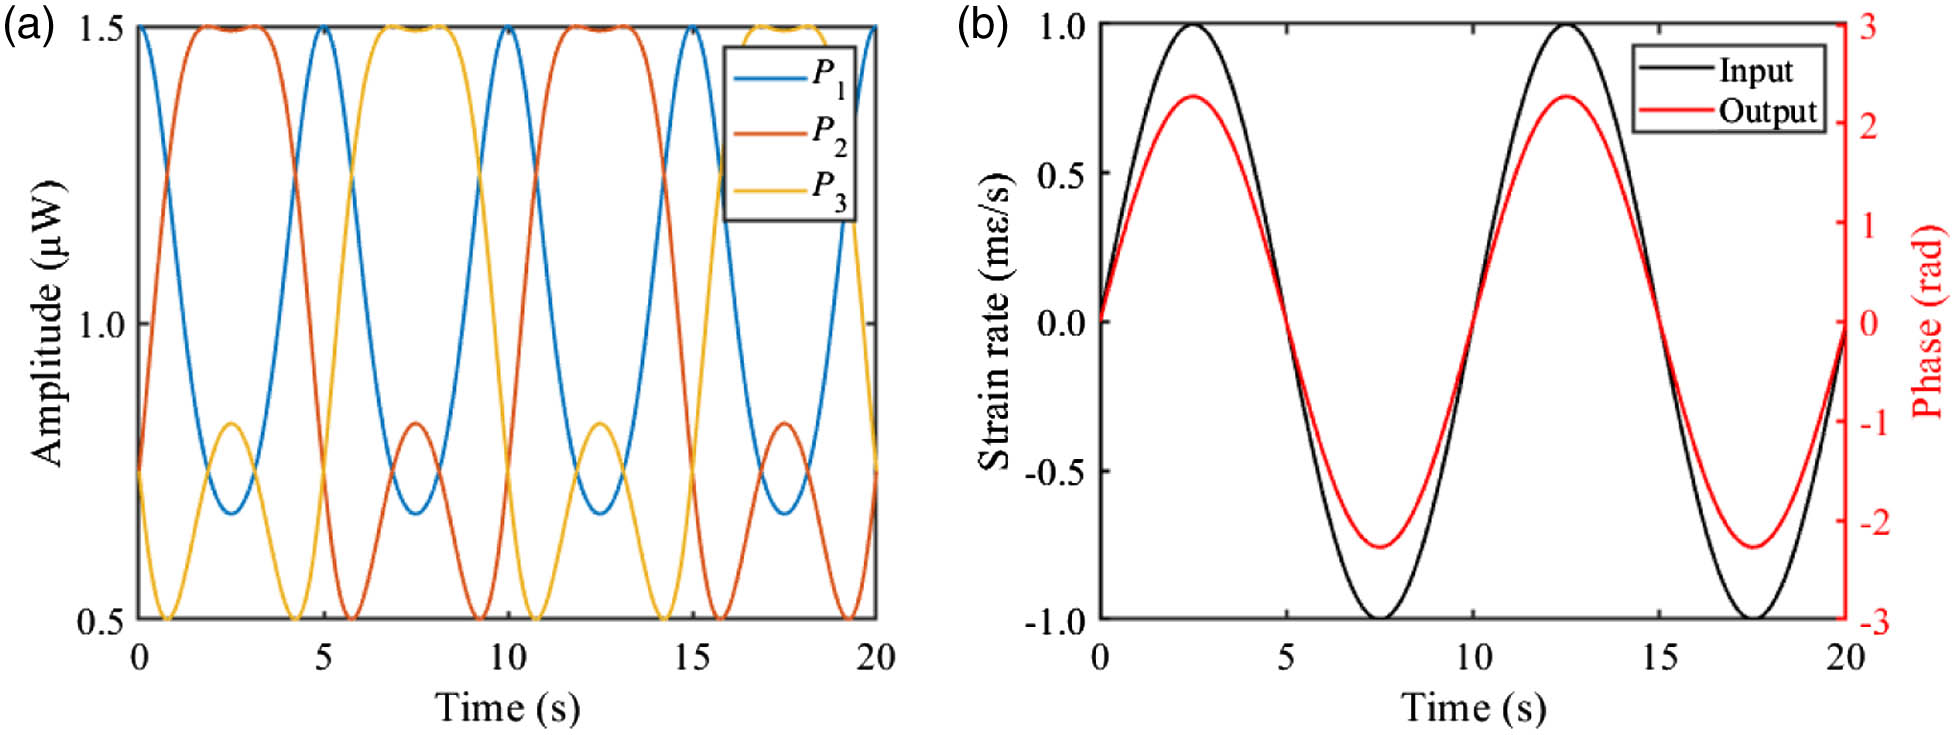
    Fig. 2. Demonstration of (a) three detection optical signals and (b) simulated strain rate and phase.
    Comparison of measured sensitivity and theoretical curve.
    Fig. 3. Comparison of measured sensitivity and theoretical curve.
    Comparison of measured phase noise floor and equivalent phase noise of RIN.
    Fig. 4. Comparison of measured phase noise floor and equivalent phase noise of RIN.
    Phase noise recorded for 10 min.
    Fig. 5. Phase noise recorded for 10 min.
    Recorded rectangular signal of 0.05 Hz.
    Fig. 6. Recorded rectangular signal of 0.05 Hz.
    Dynamic range for dynamic measurement.
    Fig. 7. Dynamic range for dynamic measurement.
    Phase noise of FOSRS II recorded over 10 min.
    Fig. 8. Phase noise of FOSRS II recorded over 10 min.
    ParameterSymbolValue
    Central wavelengthλ01545 nm
    Spectral widthΔv4 THz
    Strain-optic coefficientξ0.78
    Refractive indexn1.4682
    Length of the delay fiberLD5 km
    Length of the sensing fiberL10 m
    Length of MZI’s short armL01 m
    DC of PD signalsDi (i=1,2,3)1 μW
    AC of PD signalsAi (i=1,2,3)0.5sinc(πΔvloptc)μW
    Table 1. Simulation Parameters of FOSRS
    ReferenceGauge LengthDescriptionValue (/s)
    [13]10 mNoise RMS of DAS90
    [15]10 mSmall transients within the persistent volcanic tremor5
    [35]10 mStick-slip icequake in glaciated terrain649
    FOSRS I12.1 mDynamic/static resolution1.58/6.76
    FOSRS II25.277 kmStatic resolution0.017
    Table 2. Comparison of FOSRS and DAS
    Huicong Li, Wenzhu Huang, Wentao Zhang, Jianxiang Zhang. Fiber optic strain rate sensor based on a differentiating interferometer[J]. Photonics Research, 2022, 10(11): 2599
    Download Citation