
Huicong Li, Wenzhu Huang, Wentao Zhang, Jianxiang Zhang, "Fiber optic strain rate sensor based on a differentiating interferometer," Photonics Res. 10, 2599 (2022)
- Photonics Research
- Vol. 10, Issue 11, 2599 (2022)
Abstract
1. INTRODUCTION
The strain rate, which is defined as the derivative of the strain with respect to the time in physics, reflects the change process of the strain with time. In earthquake engineering, the dynamic response of the structure to seismic loads is related to the strain rate [1,2], and the seismic design needs to consider the strain rate effect of the structure [3,4]. In geophysics and seismology, the strain rate is important for geodetic strain measurement, tectonic study, and crustal deformation observation. This is helpful in studying aseismic deformation [5], seismicity [6], and seismic hazard assessment [7].
There are several indirect ways to measure the strain rate. For the strain rate field of crustal movement, the displacements or velocities of ground observation stations are directly obtained through global positioning system (GPS) [8,9] or interferometric synthetic aperture radar (InSAR) [7], and mathematical methods or physical models are used to construct the strain rate fields [9,10]. The observation area of this method is hundreds of kilometers and requires as complete geological data as possible, and the calculation method and correction model are complicated [11]. Distributed acoustic sensing (DAS), a novel technology for geophysical and seismological research in recent years, can analyze ground motion information by measuring the strain rate of optical cables [12]. DAS can interrogate the phase change of the backscattered light at each spatial sampling location (channel) through optical pulses and calculate the strain rate in combination with the corresponding gauge length of the channels [13–15]. In fact, the strain rate measurement of DAS is the average result of multiple channels, and there is an overlap of strain rates probed for successive DAS traces. These methods are important means of geodetic measurement and geophysical exploration, but none of them can realize the direct measurement of the strain rate, and it is difficult to process and analyze a large amount of recorded data.
Sensors that can directly measure the strain rate have been reported and are intended for the active control of high-rise buildings or structures. Lee and O’Sullivan presented a piezoelectric strain rate sensor [16], and Juston and Bauer developed a variable reluctance transformer (VRT) strain sensor [17]. However, both piezoelectric and VRT strain rate sensors are electromagnetically sensitive, and they are limited by the piezoelectric material and nonlinearity between the sensitivity and strain amplitude, respectively. In comparison, fiber optic sensing technology with the advantage of anti-electromagnetic interference has been applied in structure health monitoring [18], crustal deformation [19,20], and seismic wave detection [21]. Most importantly, the optical fiber itself is sensitive to strain and can directly sense strain and strain rate, which makes the measurement more reliable. Lo and Sirkis first presented a fiber optic strain rate sensor (FOSRS) based on Doppler wavelength shifts and proved the feasibility of fiber optic sensing for strain rate measurement [22]. These strain rate sensors, which can directly measure the strain rate, have a huge advantage in that the measured signal has a higher signal-to-noise ratio (SNR) than the differential of the strain. Regrettably, further research on sensitivity, resolution, and dynamic range is lacking. Moreover, there is no sensor for the direct measurement of the strain rate in geophysics and seismology.
Sign up for Photonics Research TOC. Get the latest issue of Photonics Research delivered right to you!Sign up now
In this paper, we propose an FOSRS that is based on a differentiating interferometer. Using the differential optical path structure of the differentiating interferometer, we perform simple, direct, and high-resolution measurements of the strain rate through a single sensing fiber to apply the FOSRS for geophysical monitoring and crustal deformation observation. The principle of strain rate sensing, the method of low-coherence interference, and the demodulation of differentiating interferometers are introduced in detail. This is the first systematic study of strain rate sensitivity, resolution, and dynamic range. The experimental results show that, for an FOSRS with a 12.1 m sensing fiber, the strain rate sensitivity is consistent in the working frequency band, the resolution reaches the nanostrain rate (
2. THEORETICAL ANALYSIS OF THE STRAIN RATE SENSOR
A. Sensing Principle
The system setup of the FOSRS is shown in Fig. 1. The sensing fiber between the
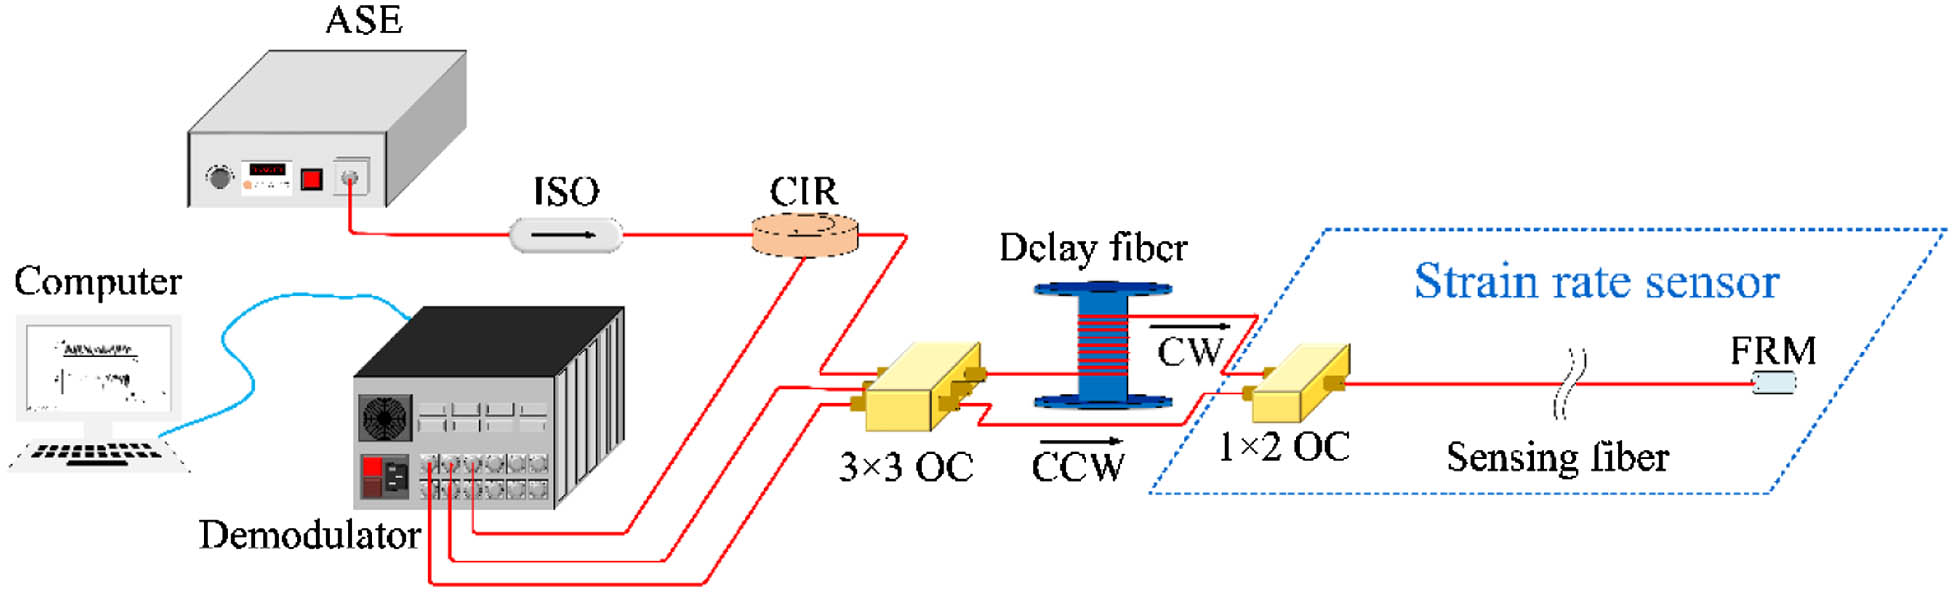
Figure 1.Fiber optic strain rate sensor system. ASE, amplified spontaneous emission light source; ISO, isolator; CIR, circulator;
The strain rate reflects the speed of the deformation and strain accumulation process. Thus, the accumulated strain causes changes in the optical path. Because of the stretch of the optical fiber, not only the baseline length but also the refractive index of the sensing fiber changes. The refractive index change of the optical fiber can be described by the Butter and Hocker relationship [23]. Then, the change in the optical path is a function of the change in the baseline length, which is expressed as
Therefore, the optical phase difference in the sensing fiber can be expressed as
In our FOSRS, an unbalanced Mach–Zehnder interferometer (MZI) and an FRM form a differentiating interferometer [24]. The two light beams entering the MZI from the
When the two light beams in MZI pass through the sensing fiber, they are both subjected to phase modulation caused by the strain rate. Because the two light beams are modulated at different times by the strain rate, the optical phase difference of the light beam that reaches the sensing fiber first is
It can be seen from Eq. (5) that the phase of the interference light is the difference between the phases modulated by the strain rate. When the time difference is extremely small, there is a linear correlation between the phase of the interference light and the differential phase modulated by the strain rate. Therefore, through the optical path structure of the differentiating interferometer, the direct relationship between the measurable optical phase and the strain rate is constructed. Combining Eqs. (1)–(5), the strain rate measured by the sensing fiber can be demodulated by the phase of the interference light and is expressed as
B. Low-Coherence Interference and Demodulation
FOSRS uses a low-coherence ASE light source that has a broad light spectrum. According to the principle of low-coherence interference and ensemble theory, the time-averaged light intensity when two light beams interfere is [25]
When the FOSRS is static,
A demodulation algorithm based on a
A simulation is carried out to prove that the demodulation algorithm based on a
Simulation Parameters of FOSRS
| Parameter | Symbol | Value |
|---|---|---|
| Central wavelength | 1545 nm | |
| Spectral width | 4 THz | |
| Strain-optic coefficient | 0.78 | |
| Refractive index | 1.4682 | |
| Length of the delay fiber | 5 km | |
| Length of the sensing fiber | 10 m | |
| Length of MZI’s short arm | 1 m | |
| DC of PD signals | 1 μW | |
| AC of PD signals |
![]()
Figure 2.Demonstration of (a) three detection optical signals and (b) simulated strain rate and phase.
C. Performance Analysis
In this section, we systematically study the strain rate sensitivity, resolution, and dynamic range of the FOSRS.
1. Sensitivity
The transfer function between the strain rate and output phase of the interference light is described with a Laplace transform:
This is the strain rate sensitivity of the FOSRS, which shows that the strain rate has a linear relationship with the phase of the interference light. The strain rate sensitivity is not a function of signal frequency, indicating that its amplitude is consistent over any working frequency band. To improve the sensitivity of the FOSRS, we can increase the baseline length of the sensing fiber, increase the length of the delay fiber, and adopt a light source with a short central wavelength.
2. Resolution
The phase noise floor of the proposed FOSRS determines the limitation of the strain rate resolution. The relative intensity noise (RIN) of the ASE light source is one of the most important factors that limit the resolution of FOSRS and is induced by the random beat of different frequencies of the ASE light source. In some broadband light source systems, especially in the study of fiber optic gyroscopes (FOGs) [27–29], the RIN is also of particular concern. Considering the equivalent phase noise of the RIN, derived from Appendix A, the minimum measurable strain rate is
3. Dynamic Range
The dynamic range of the proposed FOSRS can be analyzed by inferring the maximum measurable strain rate. The optical path difference described in Eq. (8) should be less than the coherence length of the ASE light source; otherwise, the light beams cannot interfere. A low-coherence light source has a coherence length of
When the RIN determines the resolution limitation of the strain rate, combined with Eq. (13), the theoretical dynamic range of the FOSRS can be expressed as
The dynamic range is mainly related to the central wavelength, spectral width, RIN of the light source, demodulation algorithm, and performance of the coupler. Note that this applies only to static measurement. In dynamic measurement, the maximum measurable strain rate is affected by total harmonic distortion (THD), not as described by Eq. (15). The dynamic range in dynamic measurement is smaller than that in static measurement.
3. EXPERIMENTAL RESULTS AND DISCUSSION
A. Experimental Setup
The experimental setup of the FOSRS is the same as shown in Fig. 1. The ASE light source (Lightcomm) in the FOSRS system has a central wavelength of 1545 nm and a bandwidth of
B. Sensitivity Calibration
To calibrate the strain rate sensitivity of the FOSRS, some sine voltage signals with different frequencies
According to Eq. (12), the strain rate sensitivity is calibrated, and the result is shown in Fig. 3. The sensitivity of the FOSRS is measured from 0.1 Hz to 1 kHz, which is almost flat and has the same flat trend as the theoretical sensitivity curve. This result proves that the FOSRS has the same response to the strain rate in any working frequency band. The average sensitivity measured in the experiment is 69.50 dB in a frequency band of 0.1 Hz to 1 kHz, and its maximum fluctuation is 0.61 dB. This is a difference of 1.32 dB between the average measured sensitivity and the theoretical sensitivity of 68.19 dB. From the perspective of measurement, the difference mainly comes from the errors introduced by the length measurement of the optical fibers, wavelength changes of the ASE light source, and fiber stretch of the PZT. We think that this difference is permissible.
![]()
Figure 3.Comparison of measured sensitivity and theoretical curve.
C. Resolution Test
Any disturbance of ambient noise affects the strain rate resolution of the proposed FOSRS, especially the inevitable temperature effects and unwanted vibrations. To research the strain rate resolution, we carried out a test in a basement with a relatively stable temperature and less vibration interference. The MZI, PZT, and FRM are placed in a sealed box with vibration, sound, and temperature isolation.
The 1 min phase is recorded, and its PSD is shown in Fig. 4 with a black line. Some noise peaks between 20 and 40 Hz result from ambient variations. On the whole, the phase noise floor is almost flat and less than
![]()
Figure 4.Comparison of measured phase noise floor and equivalent phase noise of RIN.
The RINs of three PDs are tested and estimated. By performing ellipse fitting on any two of the three detections, the DC components, AC components, and
Furthermore, we explore the static resolution of the FOSRS. The output phase in 10 min is recorded. Since we are interested in static strain rate measurement, low-pass filtering with a cutoff frequency of 1 Hz is used to process the recorded phase. The result is shown in Fig. 5. The standard deviation of the recorded phase is calculated to be
![]()
Figure 5.Phase noise recorded for 10 min.
To validate the strain rate measurable ability of the FOSRS, a triangular-wave voltage with a frequency of 0.05 Hz and peak-to-peak value of 20 V is applied to the PZT. Theoretically, the strain of the sensing fiber wound on the PZT is also in the form of a triangle wave. Since the FOSRS measures the strain rate, it can measure the slope of the strain, which then displays the phase in the form of a rectangular wave. The result recorded in 200 s is shown in Fig. 6 (data are filtered between 0.04 and 8 Hz). The output phase is in a rectangular wave, and its root mean square (RMS) amplitude value is approximately 65 μrad. That is, the FOSRS can measure a strain rate signal of about
![]()
Figure 6.Recorded rectangular signal of 0.05 Hz.
D. Dynamic Range Test
For the dynamic range in the dynamic strain rate measurement, the maximum measurable strain rate of the proposed FOSRS needs to be tested. When the THD of the signal at each frequency point reaches 10%, we take the corresponding phase on the PSD as the upper limitation of demodulation. Combined with the phase noise floor shown in Fig. 4, the dynamic range can be calculated and is shown in Fig. 7. The higher the signal frequency is, the smaller the dynamic range of the FOSRS. The THD can be suppressed with better algorithms such as ellipse fitting [30] to further improve the dynamic range.
![]()
Figure 7.Dynamic range for dynamic measurement.
In static strain rate measurement, the dynamic range of the FOSRS can be evaluable. Through Eq. (15), the maximum measurable strain rate can be calculated as
E. Long Baseline Sensing
In the field of geophysical monitoring and crustal deformation observation, long baseline instruments have the advantages of ultrahigh resolution and the ability to average the noise from localized effects [31]. Therefore, FOSRS with a sensing fiber length of 25.277 km is developed. First, we disconnect the optical fiber between the PZT and the
FOSRS II is placed in the same testing environment as FOSRS I. The phase noise floor of FOSRS II is tested and shown in Fig. 8. The recorded phase is filtered by a low-pass filter with a cutoff frequency of 1 Hz. Compared to the result of FOSRS I, FOSRS II has higher noise. This is due to the longer sensing fiber, which increases the sensitivity of FOSRS II and makes it more sensitive to ambient noise, such as the effect of temperature. To reduce the effect of temperature in practical applications, it is possible to use a reference interferometer, whose arm length difference is equal to the length of the sensing fiber, to eliminate the temperature variation trend. Also, the use of long sensing fibers significantly increases the thermal phase noise introduced by random thermal fluctuations in the optical fibers [32–34], resulting in a significant increment in the phase noise of FOSRS II.
![]()
Figure 8.Phase noise of FOSRS II recorded over 10 min.
The recorded phase’s standard deviation is calculated to be
In Table 2, we compare the resolution of the FOSRS with some strain rate values of the DAS. The strain rate of the DAS is calculated by measuring the relative deformation and time difference over the gauge length by demodulating the phase change of the backscattered light. The length of the sensing fiber corresponds to the gauge length of the DAS. From Table 2, the resolution of the FOSRS can be better than the noise of the DAS. Considering the strain rate amplitudes detected by DAS in volcano monitoring and microseism detection, it is shown that the FOSRS is suitable for geophysical monitoring and the detection of seismic events.
Comparison of FOSRS and DAS
| Reference | Gauge Length | Description | Value ( |
|---|---|---|---|
| [ | 10 m | Noise RMS of DAS | 90 |
| [ | 10 m | Small transients within the persistent volcanic tremor | 5 |
| [ | 10 m | Stick-slip icequake in glaciated terrain | 649 |
| FOSRS I | 12.1 m | Dynamic/static resolution | 1.58/6.76 |
| FOSRS II | 25.277 km | Static resolution | 0.017 |
4. CONCLUSION
An FOSRS based on a differentiating MZI is proposed, and its performance is researched in detail. A sensing fiber is used to directly measure the strain rate with the help of the differentiating interferometer. The flat sensitivity of the developed FOSRS with a 12.1 m sensing fiber is 69.50 dB between 0.1 Hz and 1 kHz. A dynamic strain rate resolution of
Acknowledgment
Acknowledgment. H. C. Li proposed the method, performed the experiment, analyzed the data, and wrote the draft of the paper; W. Z. Huang edited the paper and assisted in processing the data; J. X. Zhang assisted in demodulating the sensor; W. T. Zhang revised the manuscript and supervised the project.
APPENDIX A
The
RIN comes from the broadband light source and is divided into three parts after passing through a
In the FOSRS, due to the performance of the
Here,
Furthermore, the PSD of the equivalent phase noise of the RIN is
By fitting the ellipse and calibrating
References
[11] J. Wang. Calculation method of strain rate field based on GPS observation. Earthquake, 39, 122-134(2019).
[17] J. Juston, D. Bauer. Strain rate sensing for vibration control of flexible structures. 32nd Structures, Structural Dynamics, and Materials Conference, 1991-1118(1991).
[23] C. D. Butter, G. B. Hocker. Fiber optics strain gauge. Appl. Opt., 17, 2867-2869(1978).
[25] M. Born, E. Wolf. Principles of Optics: Electromagnetic Theory of Propagation, Interference and Diffraction of Light(1999).


Set citation alerts for the article
Please enter your email address

© Copyright 2018-2021 | Chinese Laser Press. All Rights Reserved 沪ICP备15018463号-20