• Acta Optica Sinica
  • Vol. 41, Issue 14, 1428003 (2021)
Yaqiong Zhang1, Wenjuan Zhang2, Zhengchao Chen2, and Haiwei Li3、*
Author Affiliations
  • 1Key Laboratory of Satellite Remote Sensing for National Environmental Protection, Center for Satellite Application on Ecology and Environment, Ministry of Ecology and Environment, Beijing 100094, China
  • 2Airborne Remote Sensing Center, Aerospace Information Research Institute, Chinese Academy of Sciences, Beijing 100094, China
  • 3Key Laboratory of Spectral Imaging Technology, Xi’an Institute of Optics and Precision Mechanics, Chinese Academy of Sciences, Xi’an, Shaanxi 710119, China
  • show less
    DOI: 10.3788/AOS202141.1428003 Cite this Article Set citation alerts
    Yaqiong Zhang, Wenjuan Zhang, Zhengchao Chen, Haiwei Li. Influence of Channel Center Wavelength Shift of the Hyperspectral Remote Sensor on Red Edge Spectra[J]. Acta Optica Sinica, 2021, 41(14): 1428003 Copy Citation Text show less
    Vegetation reflectance from ENVI spectral library
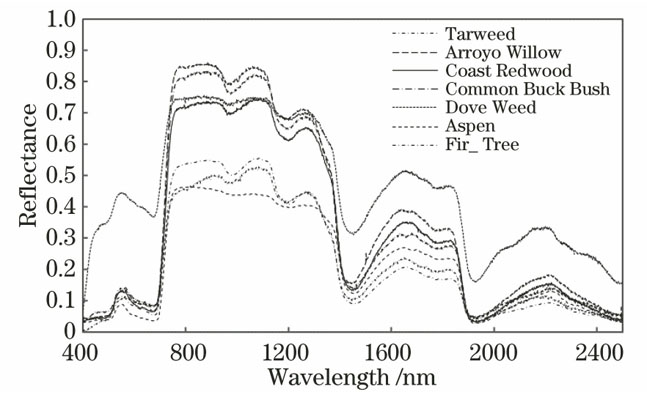
    Fig. 1. Vegetation reflectance from ENVI spectral library
    TOA radiance spectra of red-edge region simulated by Modtran (e.g., Tarweed)
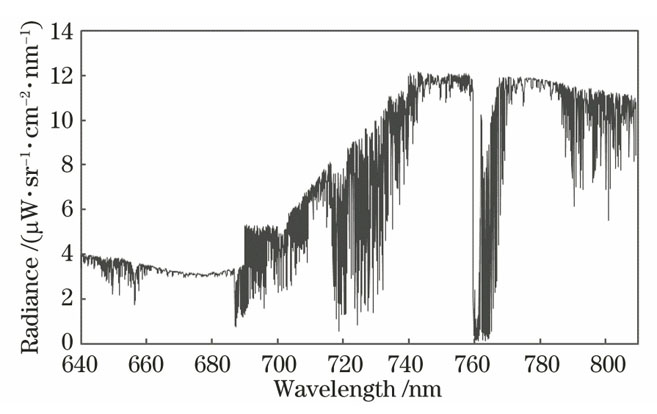
    Fig. 2. TOA radiance spectra of red-edge region simulated by Modtran (e.g., Tarweed)
    Spectral response functions of some channels in the red-edge region of Hyperion based on Gaussian function simulation (e.g., without center wavelength shift)
    Fig. 3. Spectral response functions of some channels in the red-edge region of Hyperion based on Gaussian function simulation (e.g., without center wavelength shift)
    Radiance spectra of red-edge region corresponding to different center wavelength shift values (e.g.,Tarweed)
    Fig. 4. Radiance spectra of red-edge region corresponding to different center wavelength shift values (e.g.,Tarweed)
    Reflectance spectra of red-edge region with different center wavelength shift values (e.g., tarweed)
    Fig. 5. Reflectance spectra of red-edge region with different center wavelength shift values (e.g., tarweed)
    Relationship between channel center wavelength shift and vegetation red edge shift
    Fig. 6. Relationship between channel center wavelength shift and vegetation red edge shift
    ParameterValue
    Atmosphere modelMid-latitude summer pattern
    CO2 volumetric mixing radio /10-6390
    Aerosol modelRURAL
    Surface altitude /km0.1
    Sensor altitude /km1000
    View zenith /(°)180
    Relative solar azimuth /(°)90
    Solar zenith /(°)45
    Table 1. Main input parameters of Modtran
    Channel numberCenter wavelength /nmFWHM /nmChannel numberCenter wavelength /nmFWHM /nm
    25671.0211.387132742.2510.6933
    26681.210.334933752.4310.7058
    27691.3710.390934762.610.7276
    28701.5510.459135772.7810.7907
    29711.7210.532236782.9510.8833
    30721.910.600437793.1310.9938
    31732.0710.6562   
    Table 2. Spectral parameters of the channels in the red-edge region of Hyperion sensor
    Channel center wavelength shift value /nmAveraged REP error /nmChannel center wavelength shift value /nmAveraged REP error /nm
    0.50-0.35-0.500.39
    1.00-0.75-1.000.87
    1.50-1.16-1.501.30
    2.00-1.59-2.001.82
    2.50-2.08-2.502.28
    3.00-2.60-3.002.87
    3.50-3.22-3.503.42
    4.00-3.82-4.004.03
    4.50-4.65-4.504.65
    5.00-5.52-5.005.26
    Table 3. Averaged REP errors of different vegetation types caused by center wavelength shift
    Yaqiong Zhang, Wenjuan Zhang, Zhengchao Chen, Haiwei Li. Influence of Channel Center Wavelength Shift of the Hyperspectral Remote Sensor on Red Edge Spectra[J]. Acta Optica Sinica, 2021, 41(14): 1428003
    Download Citation