• Advanced Photonics
  • Vol. 1, Issue 6, 066002 (2019)
Minh Nguyen1、†, Niko Nikolay2, Carlo Bradac1, Mehran Kianinia1, Evgeny A. Ekimov3、4, Noah Mendelson1, Oliver Benson2, and Igor Aharonovich1、*
Author Affiliations
  • 1University of Technology Sydney, School of Mathematical and Physical Sciences, Ultimo, New South Wales, Australia
  • 2Humboldt-Universität zu Berlin, AG Nanooptik, Berlin, Germany
  • 3Russian Academy of Sciences, Institute for High Pressure Physics, Moscow, Troitsk, Russia
  • 4Russian Academy of Sciences, Lebedev Physics Institute, Moscow, Russia
  • show less
    DOI: 10.1117/1.AP.1.6.066002 Cite this Article Set citation alerts
    Minh Nguyen, Niko Nikolay, Carlo Bradac, Mehran Kianinia, Evgeny A. Ekimov, Noah Mendelson, Oliver Benson, Igor Aharonovich. Photodynamics and quantum efficiency of germanium vacancy color centers in diamond[J]. Advanced Photonics, 2019, 1(6): 066002 Copy Citation Text show less
    NDs containing GeV color centers. (a) AFM image showing the typical size of the NDs. The numbered white circles refer to the corresponding height profiles. (b) Characteristic PL spectrum of a typical ND containing GeV color center(s) with ZPL at 602 nm. Inset: second-order autocorrelation function indicating emission from a single GeV, g(2)(0)=0.37±0.02. The purple shading in the spectrum indicates the band of wavelengths selected by the bandpass filter in the autocorrelation measurement.
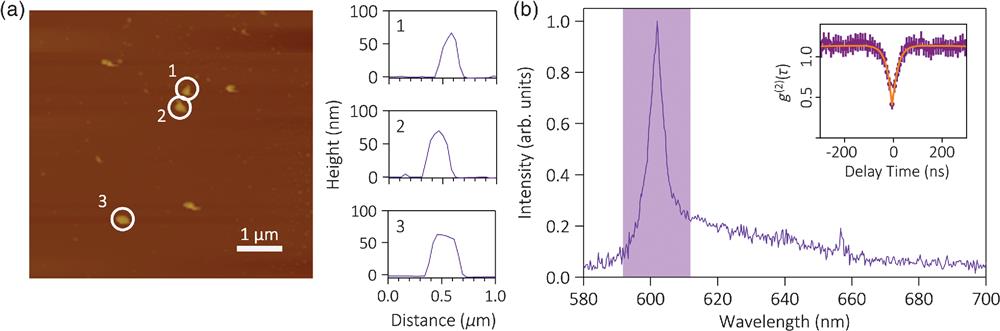
    Fig. 1. NDs containing GeV color centers. (a) AFM image showing the typical size of the NDs. The numbered white circles refer to the corresponding height profiles. (b) Characteristic PL spectrum of a typical ND containing GeV color center(s) with ZPL at 602 nm. Inset: second-order autocorrelation function indicating emission from a single GeV, g(2)(0)=0.37±0.02. The purple shading in the spectrum indicates the band of wavelengths selected by the bandpass filter in the autocorrelation measurement.
    BFP analysis of three individual GeV single-photon emitters. (a) BFP images measured experimentally for each individual emitter. (b) Corresponding simulated 2-D dipole fits. The fitted in-plane (ϕ) and out-of-plane (θ) angles of the crossed dipole (subscripts 1 and 2) for each GeV center are indicated explicitly.
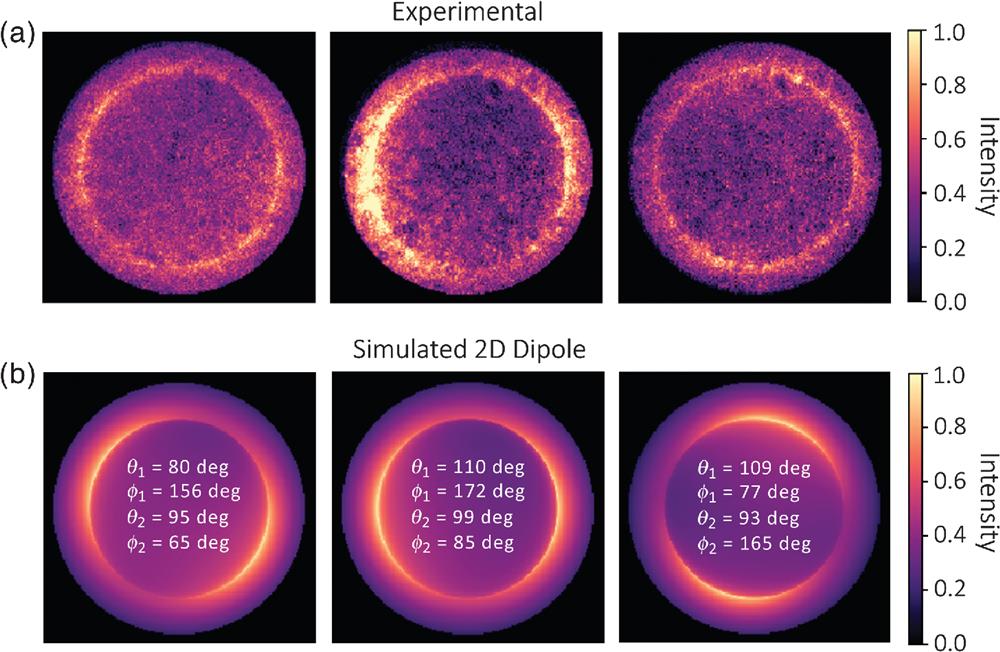
    Fig. 2. BFP analysis of three individual GeV single-photon emitters. (a) BFP images measured experimentally for each individual emitter. (b) Corresponding simulated 2-D dipole fits. The fitted in-plane (ϕ) and out-of-plane (θ) angles of the crossed dipole (subscripts 1 and 2) for each GeV center are indicated explicitly.
    Summary of the optical properties of characteristic NDs containing GeV centers. (a) Kinetic spectra measurement of a single GeV emitter, showing photostable emission at 604 nm (FWHM ~ 4.27 nm) for 500 s at 10-s integration time intervals. (b) Saturation measurement of the emitter. The extracted saturation intensity is I∞=7.14×10⁵ counts/s. (c) Histogram of the emitter lifetime. (d) Histogram of emitter ZPL position. (e) Histogram of FWHMs of the fitted ZPLs. The dotted lines represent the average values of their respective dataset. Each histogram represents a sample size of 18 individual emitters.
    Fig. 3. Summary of the optical properties of characteristic NDs containing GeV centers. (a) Kinetic spectra measurement of a single GeV emitter, showing photostable emission at 604 nm (FWHM ~ 4.27 nm) for 500 s at 10-s integration time intervals. (b) Saturation measurement of the emitter. The extracted saturation intensity is I=7.14×10⁵  counts/s. (c) Histogram of the emitter lifetime. (d) Histogram of emitter ZPL position. (e) Histogram of FWHMs of the fitted ZPLs. The dotted lines represent the average values of their respective dataset. Each histogram represents a sample size of 18 individual emitters.
    Measured QE of GeV ensembles. (a) Schematic illustration of the sample: in the first step of the experiment (cf. main text) the NDs lie on a transparent coverslip in air; in the second step of the experiment they are covered with a 1.5-μm thick layer of PMMA acting as an unbound dielectric medium. (b) Filtered emission lifetime measurements before (purple trace) and after (orange trace) deposition of ∼1.5 μm of PMMA. (c) Simulated values for the ratio between radiative rates as a function of PMMA thickness for parallel (orange trace) and perpendicular (purple trace) dipole orientations. Inset figure shows the simulated values for the range 0 to 200 nm.
    Fig. 4. Measured QE of GeV ensembles. (a) Schematic illustration of the sample: in the first step of the experiment (cf. main text) the NDs lie on a transparent coverslip in air; in the second step of the experiment they are covered with a 1.5-μm thick layer of PMMA acting as an unbound dielectric medium. (b) Filtered emission lifetime measurements before (purple trace) and after (orange trace) deposition of 1.5  μm of PMMA. (c) Simulated values for the ratio between radiative rates as a function of PMMA thickness for parallel (orange trace) and perpendicular (purple trace) dipole orientations. Inset figure shows the simulated values for the range 0 to 200 nm.
    Minh Nguyen, Niko Nikolay, Carlo Bradac, Mehran Kianinia, Evgeny A. Ekimov, Noah Mendelson, Oliver Benson, Igor Aharonovich. Photodynamics and quantum efficiency of germanium vacancy color centers in diamond[J]. Advanced Photonics, 2019, 1(6): 066002
    Download Citation