• Acta Optica Sinica
  • Vol. 39, Issue 4, 0416003 (2019)
Shuangmou Hui1, Yinqun Hua1、2、*, and Zhibao Li1
Author Affiliations
  • 1 School of Material Science and Engineering, Jiangsu University, Zhenjiang, Jiangsu 212013, China
  • 2 School of Mechanical Engineering, Jiangsu University, Zhenjiang, Jiangsu 212013, China
  • show less
    DOI: 10.3788/AOS201939.0416003 Cite this Article Set citation alerts
    Shuangmou Hui, Yinqun Hua, Zhibao Li. Simulation of Anti-Reflection Properties of Uniform and Hybrid Moth-Eye Structures[J]. Acta Optica Sinica, 2019, 39(4): 0416003 Copy Citation Text show less
    Schematics of three-dimensional simulation models and their parameter setting. (a) Three-dimensional schematic of UMS; (b) three-dimensional schematic of BHMS; (c) three-dimensional schematic of flat structure; (d) parameter setting of UMS ; (e) parameter setting of BHMS
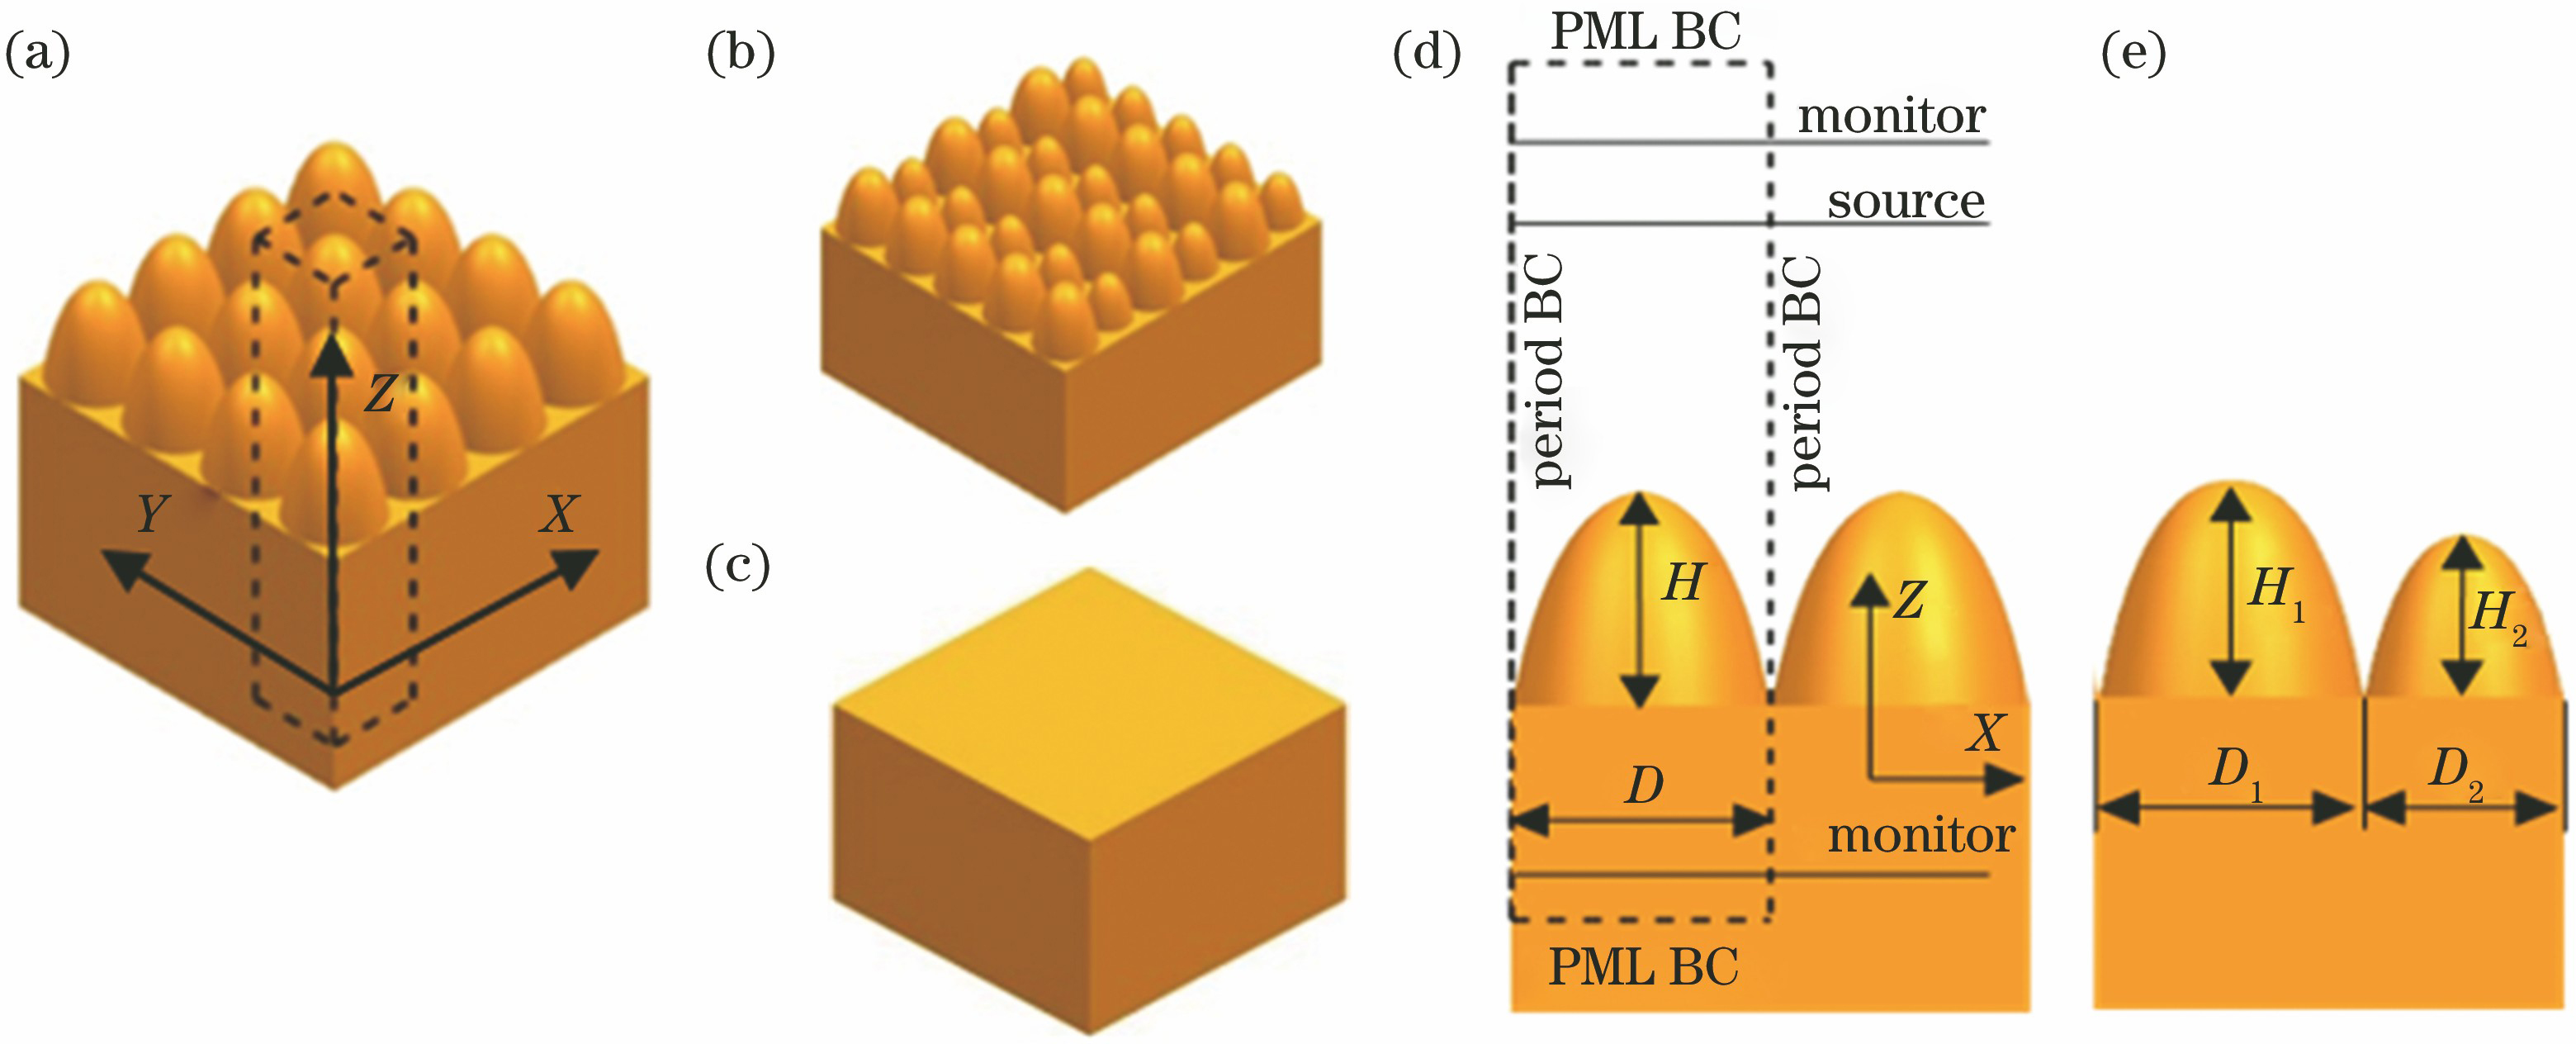
    Fig. 1. Schematics of three-dimensional simulation models and their parameter setting. (a) Three-dimensional schematic of UMS; (b) three-dimensional schematic of BHMS; (c) three-dimensional schematic of flat structure; (d) parameter setting of UMS ; (e) parameter setting of BHMS
    Refractive index n and extinction coefficient k curves of single crystal silicon. (a) Refractive index n curve; (b) extinction coefficient k curve
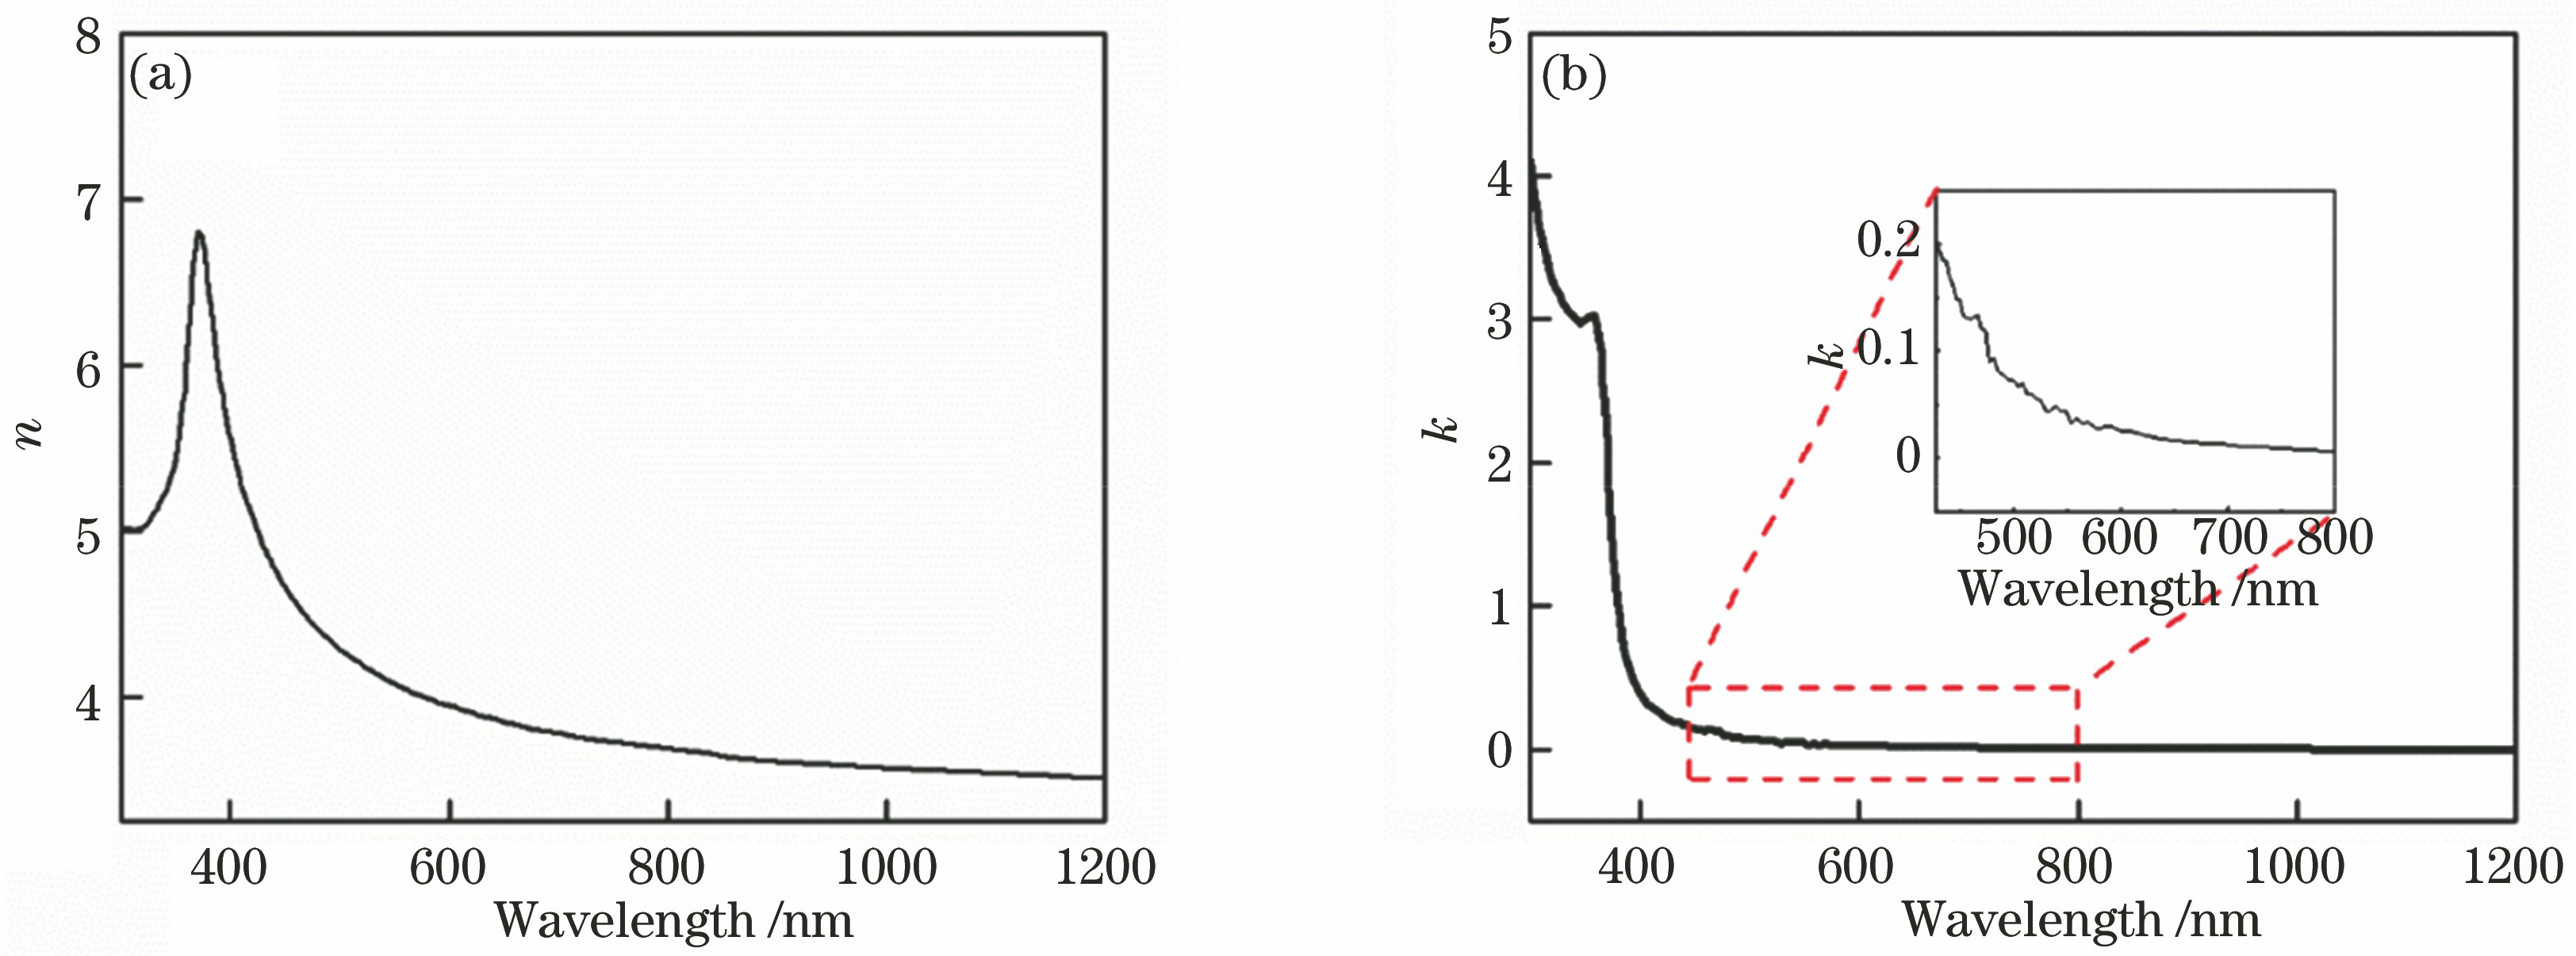
    Fig. 2. Refractive index n and extinction coefficient k curves of single crystal silicon. (a) Refractive index n curve; (b) extinction coefficient k curve
    Reflectance curves of UMS. (a) D= 250 nm; (b) H= 600 nm
    Fig. 3. Reflectance curves of UMS. (a) D= 250 nm; (b) H= 600 nm
    Equivalent refractive index curves and average reflectance contour plot of UMS. (a) Equivalent refractive index curves of UMS when D=250 nm; (b) reflectance contour plot of UMS
    Fig. 4. Equivalent refractive index curves and average reflectance contour plot of UMS. (a) Equivalent refractive index curves of UMS when D=250 nm; (b) reflectance contour plot of UMS
    Average reflectance contour maps of BHMS. (a) D1=D2=250 nm; (b) H1=H2=600 nm
    Fig. 5. Average reflectance contour maps of BHMS. (a) D1=D2=250 nm; (b) H1=H2=600 nm
    Reflectance curves of BHMS and UMS
    Fig. 6. Reflectance curves of BHMS and UMS
    Electric field intensity distributions of four structures on Y=0 section. (a) Slab silicon structure; (b) UMS(D=200 nm); (c) UMS(D=300 nm); (d) BHMS(D1=300 nm & D2=200 nm)
    Fig. 7. Electric field intensity distributions of four structures on Y=0 section. (a) Slab silicon structure; (b) UMS(D=200 nm); (c) UMS(D=300 nm); (d) BHMS(D1=300 nm & D2=200 nm)
    Reflectance curves of THMS and BHMS
    Fig. 8. Reflectance curves of THMS and BHMS
    Shuangmou Hui, Yinqun Hua, Zhibao Li. Simulation of Anti-Reflection Properties of Uniform and Hybrid Moth-Eye Structures[J]. Acta Optica Sinica, 2019, 39(4): 0416003
    Download Citation