• Photonics Research
  • Vol. 10, Issue 7, 1777 (2022)
Boyu Gu1、2、3 and Yuhua Zhang1、2、*
Author Affiliations
  • 1Doheny Eye Institute, Pasadena, California 91103, USA
  • 2Department of Ophthalmology, University of California - Los Angeles, Los Angeles, California 90095, USA
  • 3Currently at School of Computer and Information Engineering, Tianjin Chengjian University, Tianjin 300384, China
  • show less
    DOI: 10.1364/PRJ.452364 Cite this Article Set citation alerts
    Boyu Gu, Yuhua Zhang. Adaptive optics wavefront correction using a damped transpose matrix of the influence function[J]. Photonics Research, 2022, 10(7): 1777 Copy Citation Text show less
    Adaptive optics testing system. LS, laser source; L1–L5, lenses; S, optical aperture; BS, beam splitter; WS, wavefront sensor.
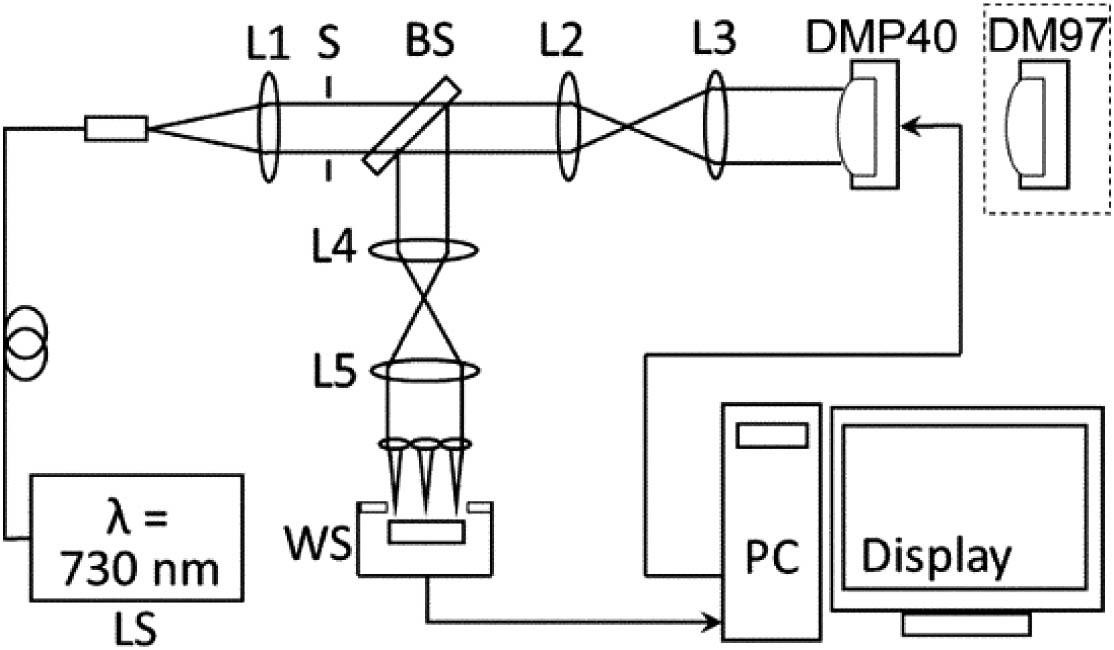
    Fig. 1. Adaptive optics testing system. LS, laser source; L1–L5, lenses; S, optical aperture; BS, beam splitter; WS, wavefront sensor.
    Influence function of the adaptive optics testing system with deformable mirror Thorlabs DMP40. (a) Influence function matrix (IFM). (b) Correlation matrix of IFM. (c) Singular values of the IFM, the dashed line indicates the optimal number of truncated singular values (modes). (d) Transpose matrix of IFM. (e) The inverse of the IFM with truncated singular value decomposition (TSVD) at the singular value indicated in (c). The color bar in (d) also applies to (a).
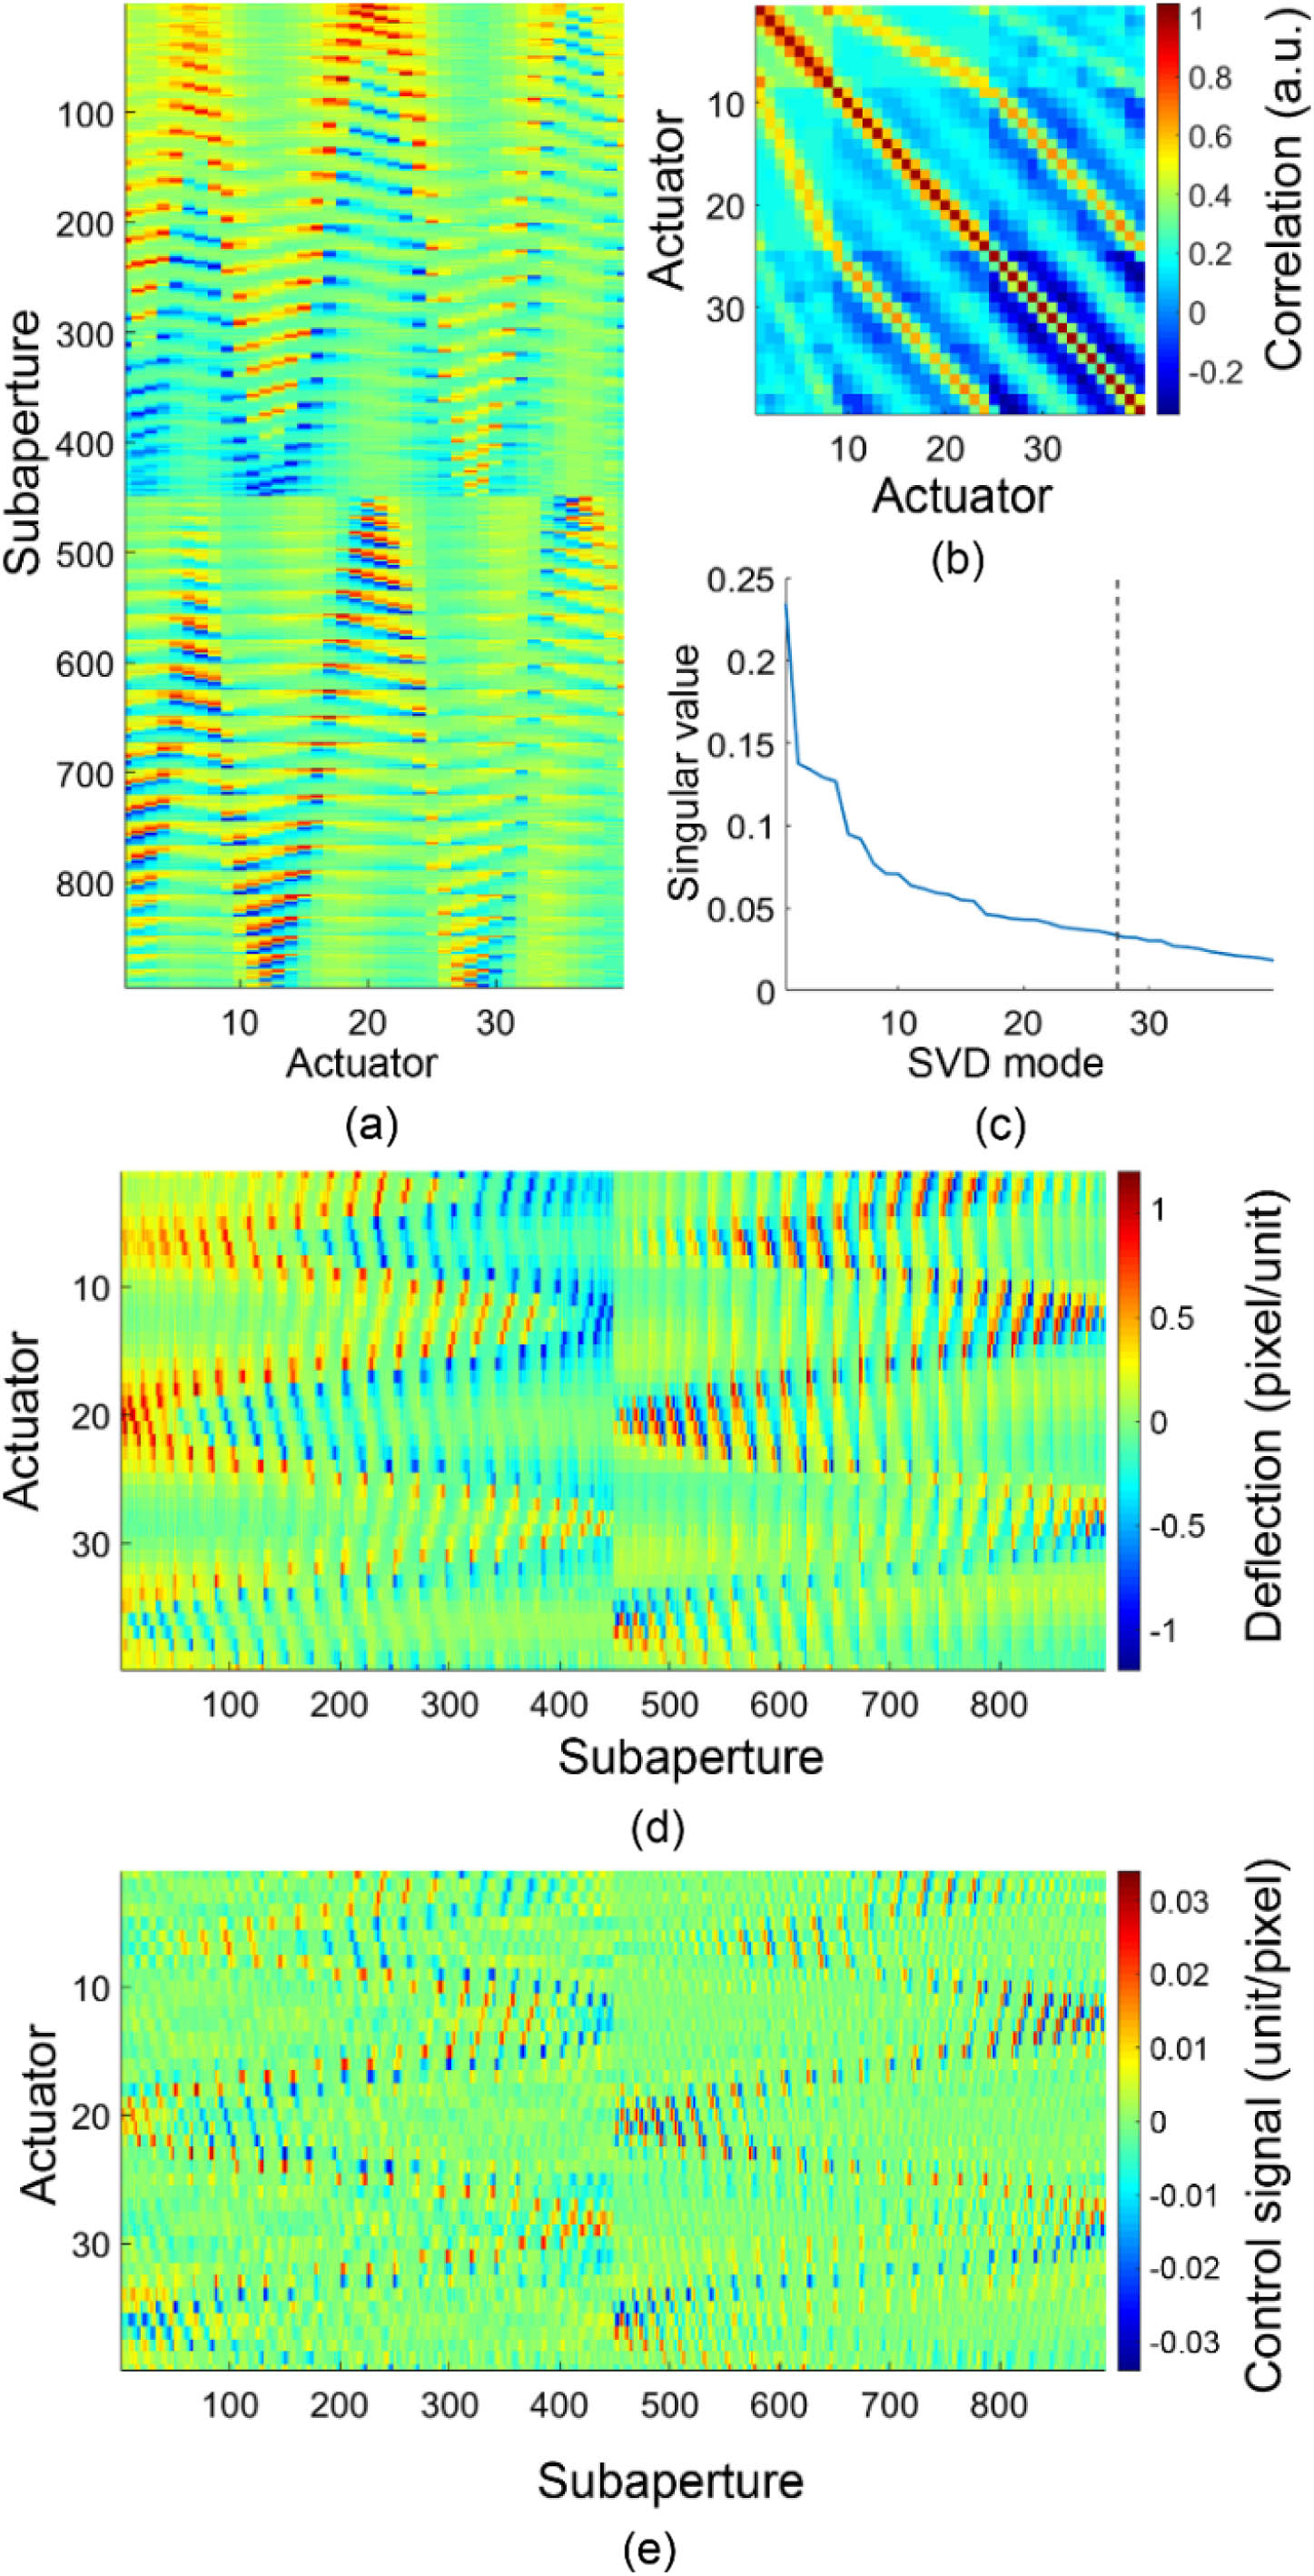
    Fig. 2. Influence function of the adaptive optics testing system with deformable mirror Thorlabs DMP40. (a) Influence function matrix (IFM). (b) Correlation matrix of IFM. (c) Singular values of the IFM, the dashed line indicates the optimal number of truncated singular values (modes). (d) Transpose matrix of IFM. (e) The inverse of the IFM with truncated singular value decomposition (TSVD) at the singular value indicated in (c). The color bar in (d) also applies to (a).
    Influence function of the adaptive optics testing system with deformable mirror ALPAO DM97. (a) Influence function matrix (IFM). (b) Correlation matrix of IFM. (c) Singular values of the IFM, the dashed line indicates the optimal number of truncated singular values (modes). (d) Transpose matrix of IFM. (e) The inverse of the IFM with truncated singular value decomposition (TSVD) at the singular value indicated in (c). The color bar in (d) also applies to (a).
    Fig. 3. Influence function of the adaptive optics testing system with deformable mirror ALPAO DM97. (a) Influence function matrix (IFM). (b) Correlation matrix of IFM. (c) Singular values of the IFM, the dashed line indicates the optimal number of truncated singular values (modes). (d) Transpose matrix of IFM. (e) The inverse of the IFM with truncated singular value decomposition (TSVD) at the singular value indicated in (c). The color bar in (d) also applies to (a).
    Adaptive optics (AO) correction for wavefront aberration using wavefront reconstructors built with truncated single value decomposition (TSVD) of the influence function matrix. The AO was operated to flatten the deformable mirrors from their free (unpowered) state in the AO testing system shown in Fig. 1. The AO worked with a closed-loop integral controller. (a) Data were recorded using the ALPAO DM97 deformable mirror. (b) Data were acquired using the Thorlabs DMP40 deformable mirror. The numbers outside the parentheses indicate how many singular values were set to zero (i.e., truncated). Those in the parentheses are corresponding condition numbers (ratio of maximum singular value over minimum singular value).
    Fig. 4. Adaptive optics (AO) correction for wavefront aberration using wavefront reconstructors built with truncated single value decomposition (TSVD) of the influence function matrix. The AO was operated to flatten the deformable mirrors from their free (unpowered) state in the AO testing system shown in Fig. 1. The AO worked with a closed-loop integral controller. (a) Data were recorded using the ALPAO DM97 deformable mirror. (b) Data were acquired using the Thorlabs DMP40 deformable mirror. The numbers outside the parentheses indicate how many singular values were set to zero (i.e., truncated). Those in the parentheses are corresponding condition numbers (ratio of maximum singular value over minimum singular value).
    Adaptive optics (AO) correction for wave aberration using different reconstructors and deformable mirrors. The AO was performed to flatten the deformable mirror from its free (unpowered) state. (a), (b) Testing results of AO using the Thorlabs DMP40. The wavefront aberration was measured in μm (a) and in the root mean square (RMS) of the pixel numbers of the centroids of deflections (b). (c), (d) Data of AO using the ALPAO DM97. The wavefront aberration was measured in μm (c) and the RMS of the centroids of deflections in pixel numbers (d). Color legends in (a) apply to all panels.
    Fig. 5. Adaptive optics (AO) correction for wave aberration using different reconstructors and deformable mirrors. The AO was performed to flatten the deformable mirror from its free (unpowered) state. (a), (b) Testing results of AO using the Thorlabs DMP40. The wavefront aberration was measured in μm (a) and in the root mean square (RMS) of the pixel numbers of the centroids of deflections (b). (c), (d) Data of AO using the ALPAO DM97. The wavefront aberration was measured in μm (c) and the RMS of the centroids of deflections in pixel numbers (d). Color legends in (a) apply to all panels.
    Residual wave aberration after adaptive optics correction using different reconstructors and deformable mirrors. AO was performed to flatten the deformable mirror from its free (unpowered) state. (a)–(c) Results obtained from the Thorlabs DMP40. (a) Root mean square (RMS) of coefficients of the 2nd to 10th orders of Zernike modes. (b) RMS of all Zernike coefficients. (c) Residual wavefront aberration was assessed by the RMS of the centroids of deflections in all sub-apertures of the wavefront sensor, measured in pixel numbers. (d)–(f) Results from the ALPAO DM97. (d) RMS of coefficients of the 2nd to 10th orders of Zernike modes. (e) RMS of all Zernike coefficients. (f) Residual wave aberration was assessed by RMS of centroids of deflections measured in pixel numbers. The residual aberrations in (b), (c), (e), and (f) were averaged from the last five (496th–500th) loops of AO correction. Error bars indicate standard deviations. Color legends in (a) apply to all panels.
    Fig. 6. Residual wave aberration after adaptive optics correction using different reconstructors and deformable mirrors. AO was performed to flatten the deformable mirror from its free (unpowered) state. (a)–(c) Results obtained from the Thorlabs DMP40. (a) Root mean square (RMS) of coefficients of the 2nd to 10th orders of Zernike modes. (b) RMS of all Zernike coefficients. (c) Residual wavefront aberration was assessed by the RMS of the centroids of deflections in all sub-apertures of the wavefront sensor, measured in pixel numbers. (d)–(f) Results from the ALPAO DM97. (d) RMS of coefficients of the 2nd to 10th orders of Zernike modes. (e) RMS of all Zernike coefficients. (f) Residual wave aberration was assessed by RMS of centroids of deflections measured in pixel numbers. The residual aberrations in (b), (c), (e), and (f) were averaged from the last five (496th–500th) loops of AO correction. Error bars indicate standard deviations. Color legends in (a) apply to all panels.
    Evaluation of the performance of adaptive optics (AO) using different reconstructors. The AO system was tested under various wavefront aberrations introduced by placing spherical trial lenses at a plane conjugate to the deformable mirror. (a), (b) Results for the AO using the Thorlabs DMP40. (a) RMS of the residual aberration measured by all Zernike modes in μm. (b) RMS of the centroid deflections in all sub-apertures of the wavefront sensor, measured in pixel numbers. (c), (d) Results for AO using the DM ALPAO DM97. (c) RMS of the residual aberration measured by all Zernike modes in μm. (d) RMS of the light centroid deflections measured in pixel numbers. The residual aberrations were averaged from the last five (496th–500th) loops of AO correction. Error bars indicate standard deviations. Color legends in (d) apply to all panels.
    Fig. 7. Evaluation of the performance of adaptive optics (AO) using different reconstructors. The AO system was tested under various wavefront aberrations introduced by placing spherical trial lenses at a plane conjugate to the deformable mirror. (a), (b) Results for the AO using the Thorlabs DMP40. (a) RMS of the residual aberration measured by all Zernike modes in μm. (b) RMS of the centroid deflections in all sub-apertures of the wavefront sensor, measured in pixel numbers. (c), (d) Results for AO using the DM ALPAO DM97. (c) RMS of the residual aberration measured by all Zernike modes in μm. (d) RMS of the light centroid deflections measured in pixel numbers. The residual aberrations were averaged from the last five (496th–500th) loops of AO correction. Error bars indicate standard deviations. Color legends in (d) apply to all panels.
    Adaptive optics using different reconstructors tested in the adaptive optics scanning laser ophthalmoscope (AOSLO). The AO was performed to correct the system wavefront aberration of the AOSLO when the deformable mirrors were unpowered. (a)–(c) Results tested with the deformable mirror Mirao 52e. (d)–(f) Data of deformable mirror ALPAO DM97. The residual aberrations in (c) and (f) were averaged from the last five (996th–1000th) loops of AO correction. Error bars indicate standard deviations. Color legends in (a) apply to all panels.
    Fig. 8. Adaptive optics using different reconstructors tested in the adaptive optics scanning laser ophthalmoscope (AOSLO). The AO was performed to correct the system wavefront aberration of the AOSLO when the deformable mirrors were unpowered. (a)–(c) Results tested with the deformable mirror Mirao 52e. (d)–(f) Data of deformable mirror ALPAO DM97. The residual aberrations in (c) and (f) were averaged from the last five (996th–1000th) loops of AO correction. Error bars indicate standard deviations. Color legends in (a) apply to all panels.
    Evaluation of adaptive optics (AO) performance using different reconstructors in the adaptive optics scanning laser ophthalmoscope (AOSLO). The brightness of the model eye’s retinal image was measured before and after AO correction for wavefront aberration. The wavefront aberration was introduced by placing a trial lens at the pupil plane of the model eye. (a), (b) Image brightness improvement by AO compensation for spherical and cylindrical wave aberrations. Color legends in (a) apply to all panels. This test was done with the ALPAO DM97 deformable mirror.
    Fig. 9. Evaluation of adaptive optics (AO) performance using different reconstructors in the adaptive optics scanning laser ophthalmoscope (AOSLO). The brightness of the model eye’s retinal image was measured before and after AO correction for wavefront aberration. The wavefront aberration was introduced by placing a trial lens at the pupil plane of the model eye. (a), (b) Image brightness improvement by AO compensation for spherical and cylindrical wave aberrations. Color legends in (a) apply to all panels. This test was done with the ALPAO DM97 deformable mirror.
    Evaluation of adaptive optics (AO) performance using different reconstructors in the adaptive optics near-confocal ophthalmoscope (AONCO). Retinal images of the model eye were acquired before and after AO correction for wavefront aberration. The wavefront aberration was introduced by placing a spherical trial lens at the pupil plane of the model eye. (a) Retinal image of the model eye and its histogram before AO correction. (b) Using the Zonal[IM] wavefront reconstructor and a gain factor of 0.3, the model eye retinal image and its histogram after AO correction. (c) AO correction using the Zonal[TM]. The root mean square (RMS) initial wavefront aberration was 1.50 μm.
    Fig. 10. Evaluation of adaptive optics (AO) performance using different reconstructors in the adaptive optics near-confocal ophthalmoscope (AONCO). Retinal images of the model eye were acquired before and after AO correction for wavefront aberration. The wavefront aberration was introduced by placing a spherical trial lens at the pupil plane of the model eye. (a) Retinal image of the model eye and its histogram before AO correction. (b) Using the Zonal[IM] wavefront reconstructor and a gain factor of 0.3, the model eye retinal image and its histogram after AO correction. (c) AO correction using the Zonal[TM]. The root mean square (RMS) initial wavefront aberration was 1.50 μm.
    Boyu Gu, Yuhua Zhang. Adaptive optics wavefront correction using a damped transpose matrix of the influence function[J]. Photonics Research, 2022, 10(7): 1777
    Download Citation