
Bin Liu, Jianan Xin, Wenjiang Chen. Image Contrast Enhancement Combining Nonseparable Wavelet Analysis and Curve Fitting Method[J]. Laser & Optoelectronics Progress, 2018, 55(2): 021010
- Laser & Optoelectronics Progress
- Vol. 55, Issue 2, 021010 (2018)
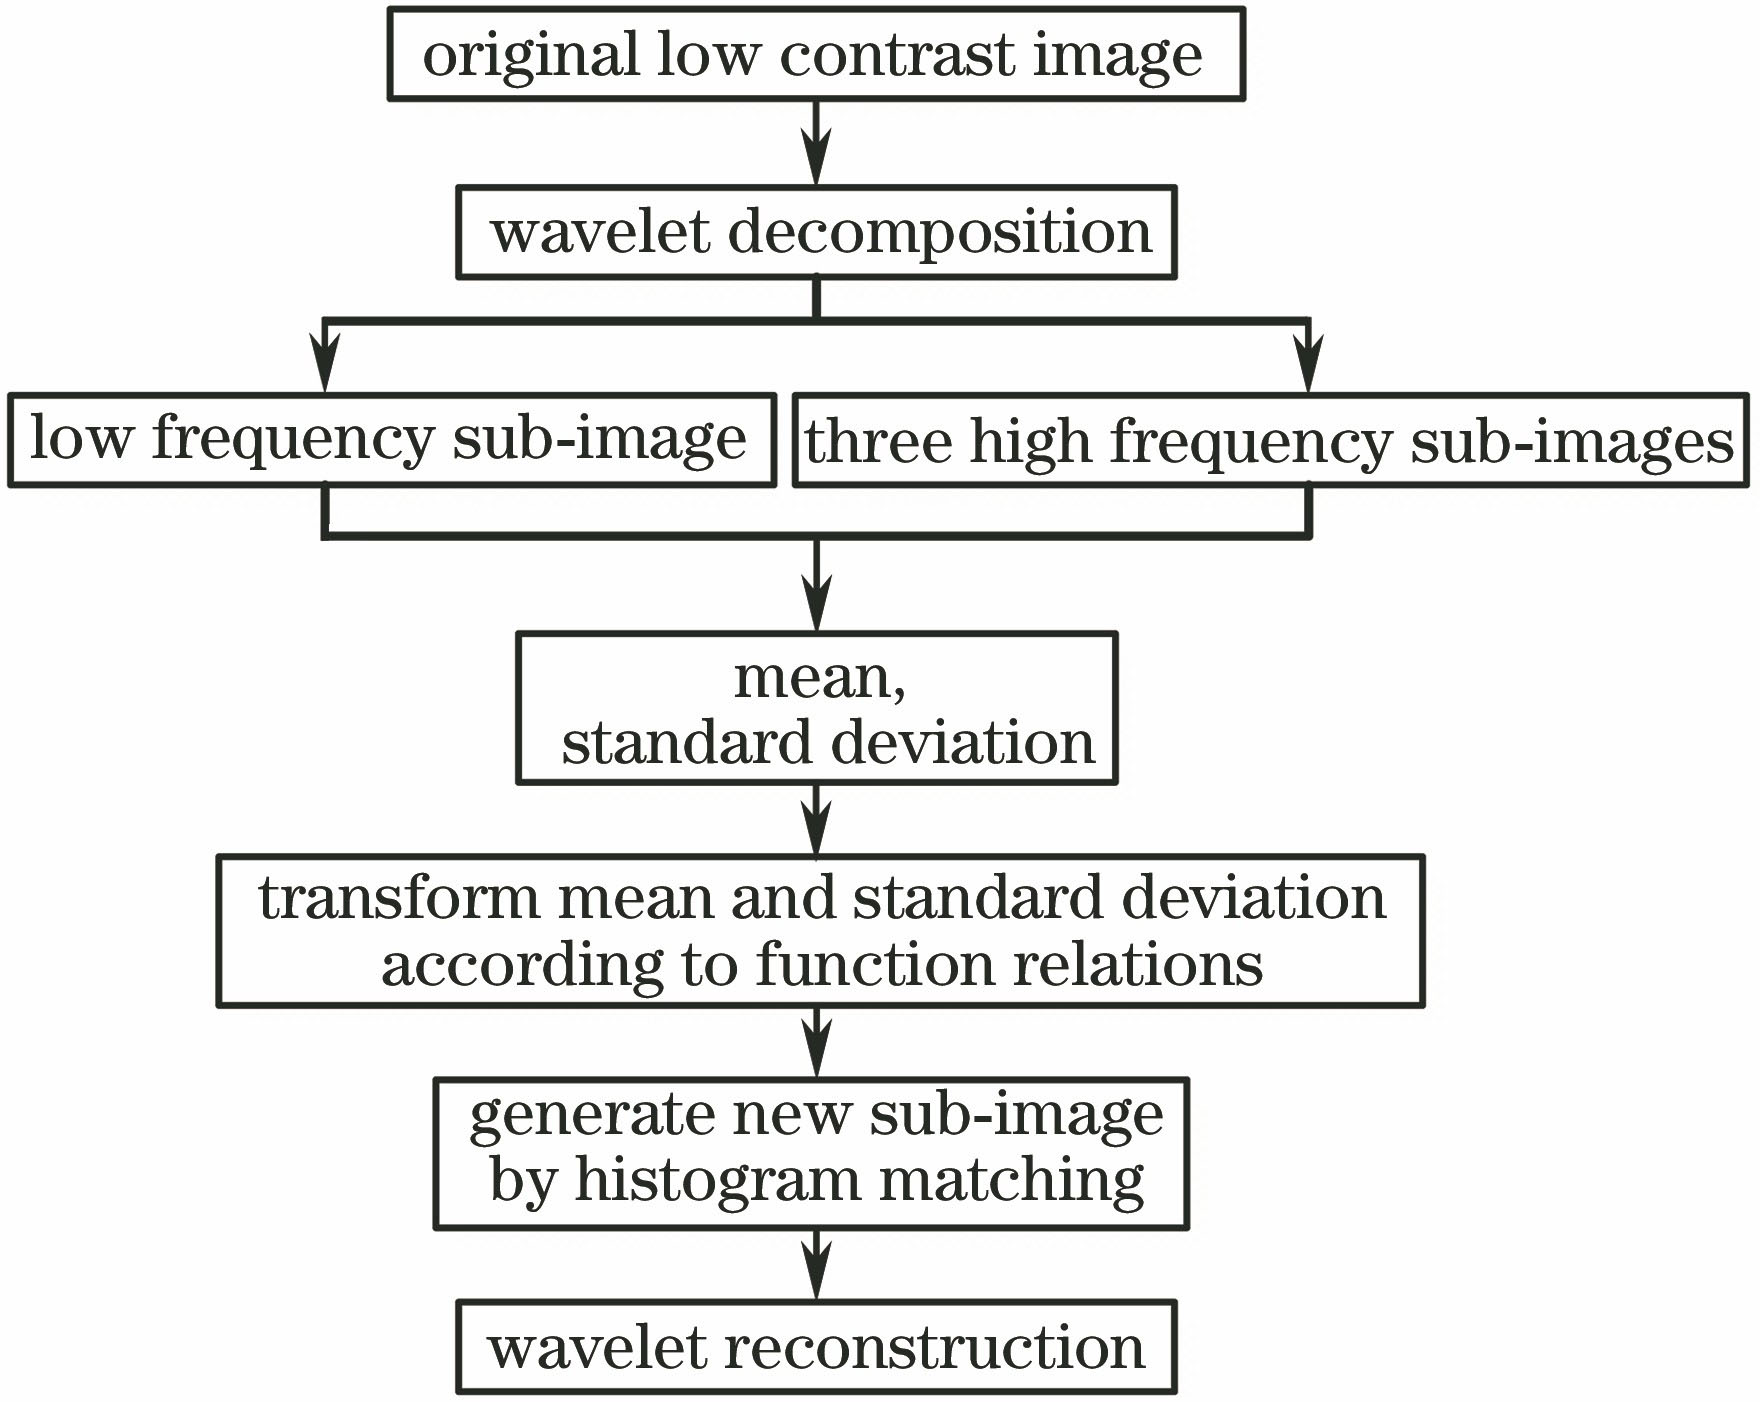
Fig. 1. Flow chart of algorithm
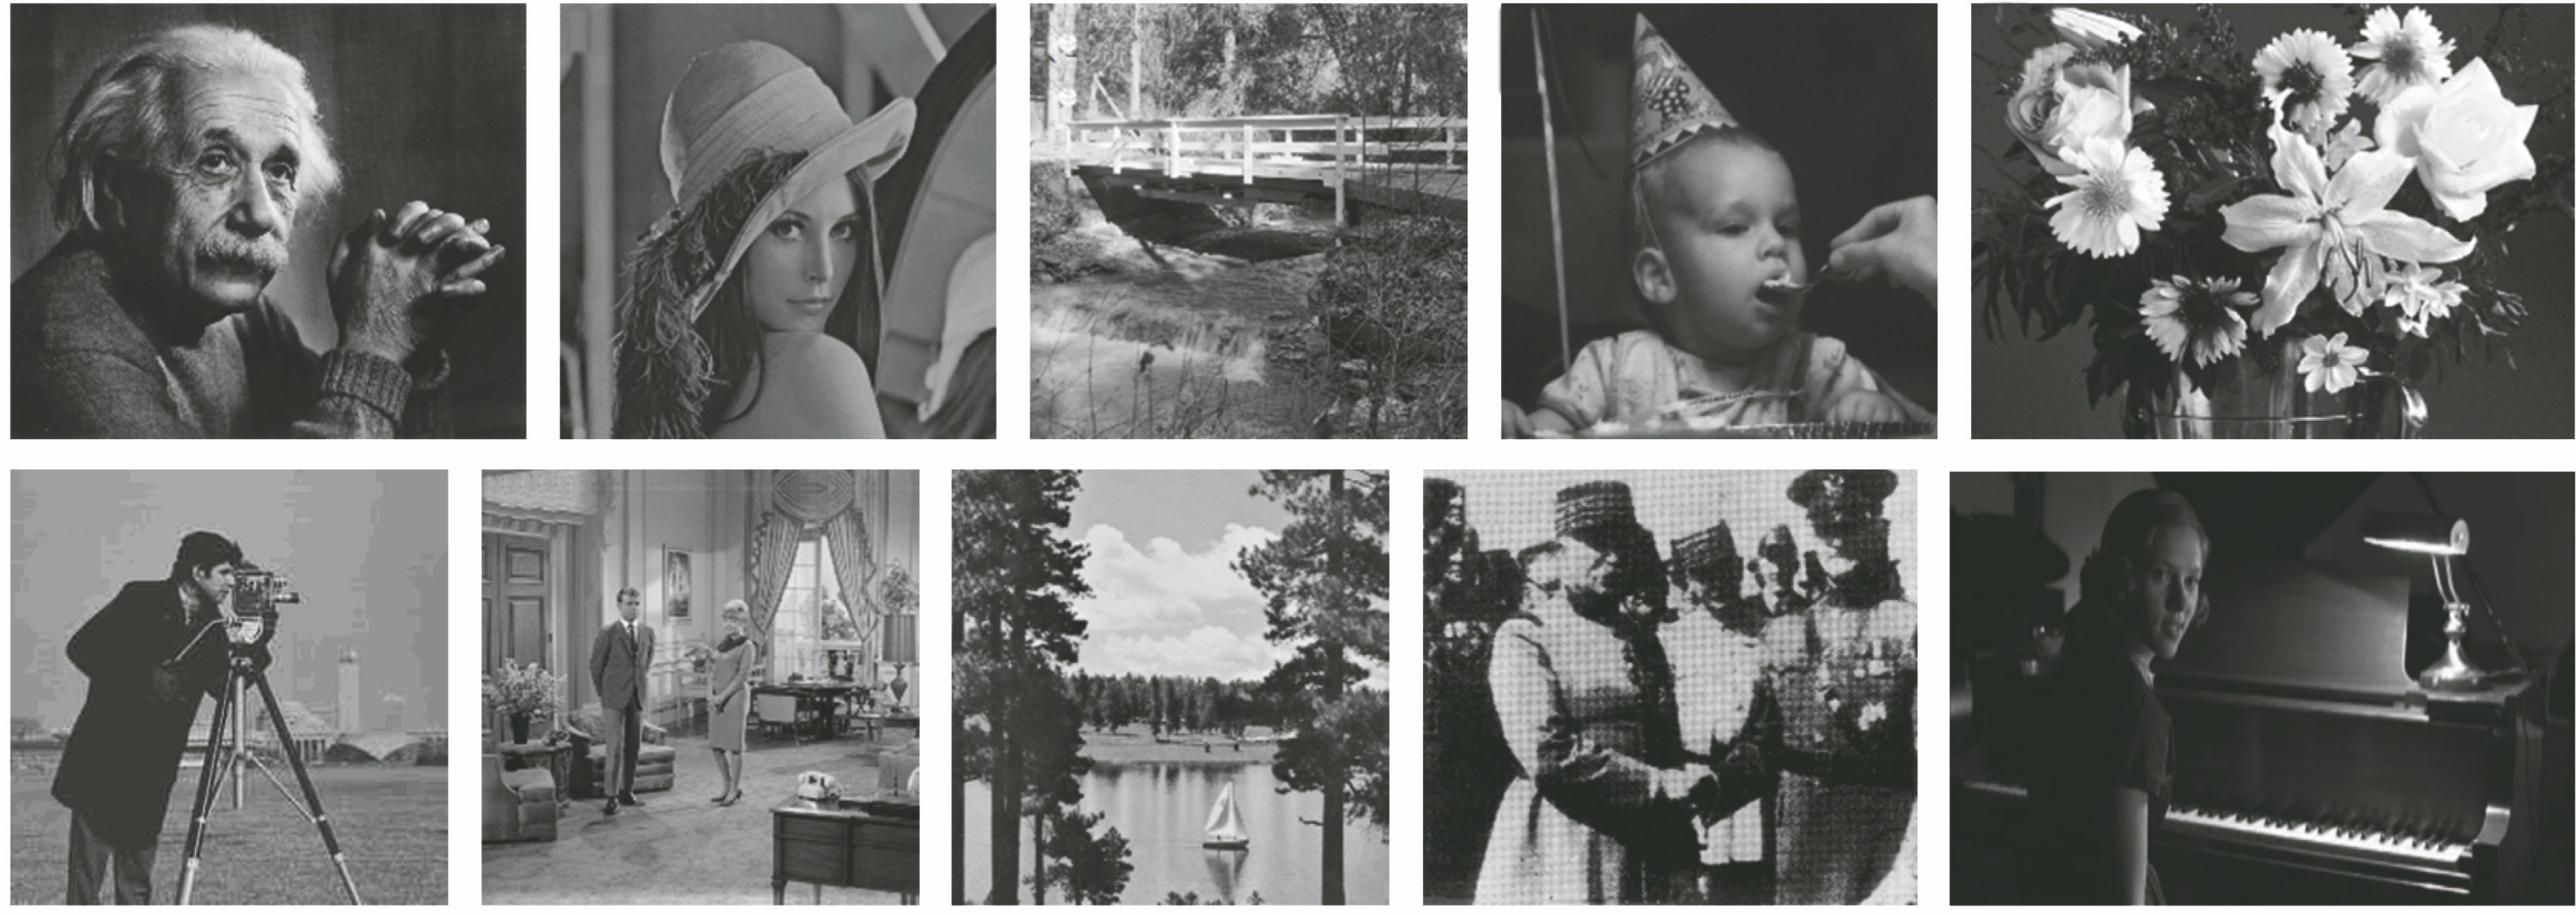
Fig. 2. Original standard clear images
Fig. 3. Original low contrast images
Fig. 4. Fitting curve of mBA and mCA
Fig. 5. Fitting curve of sBA and sCA
Fig. 6. Fitting curve of mBH and mCH
Fig. 7. Fitting curve of sBH and sCH
Fig. 8. Fitting curve of mBV and mCV
Fig. 9. Fitting curve of sBV and sCV
Fig. 10. Fitting curve of mBD and mCD
Fig. 11. Fitting curve of sBD and sCD
Fig. 12. Comparison of enhancement effects and histograms by different algorithms. (a) Without using image contrast enhancement method; (b) linear gray transformation method; (c) histogram equalization method; (d) method in Ref. [21]; (e) proposed method
Fig. 13. Comparison of enhancement effects and histograms by different algorithms. (a) Without using image contrast enhancement method; (b) linear gray transformation method; (c) histogram equalization method; (d) method in Ref. [21]; (e) proposed method
Fig. 14. Comparison of enhancement effects and histograms by different algorithms. (a) Without using image contrast enhancement method; (b) linear gray transformation method; (c) histogram equalization method; (d) method in Ref. [21]; (e) proposed method
|
Table 1. Original image and comparison of clarity and standard deviation of enhancement images obtained by four methods

Set citation alerts for the article
Please enter your email address
© Copyright 2018-2021 | Chinese Laser Press. All Rights Reserved 沪ICP备15018463号-20